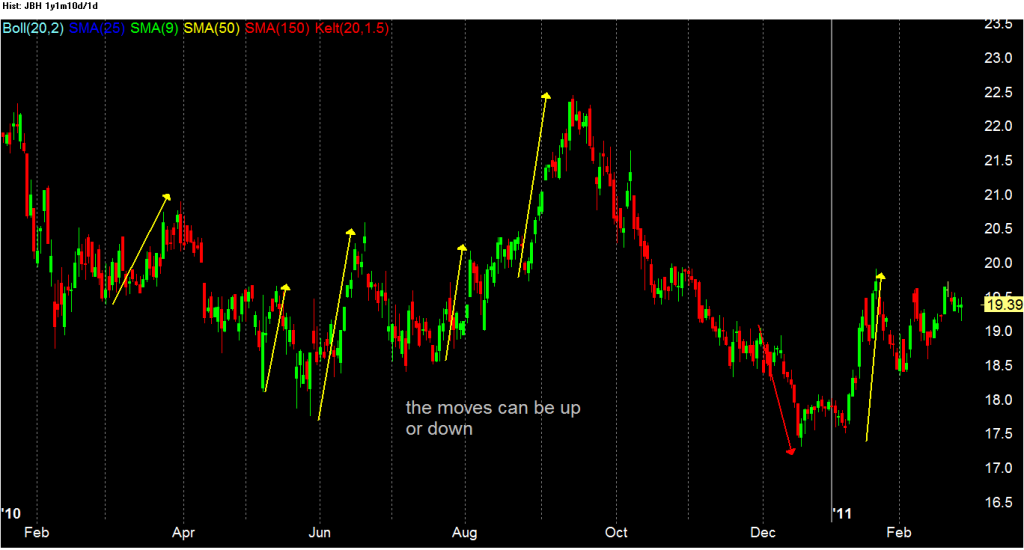
The more I think about San Felipe's call for a drop into March the more nervous I'm getting....
------------
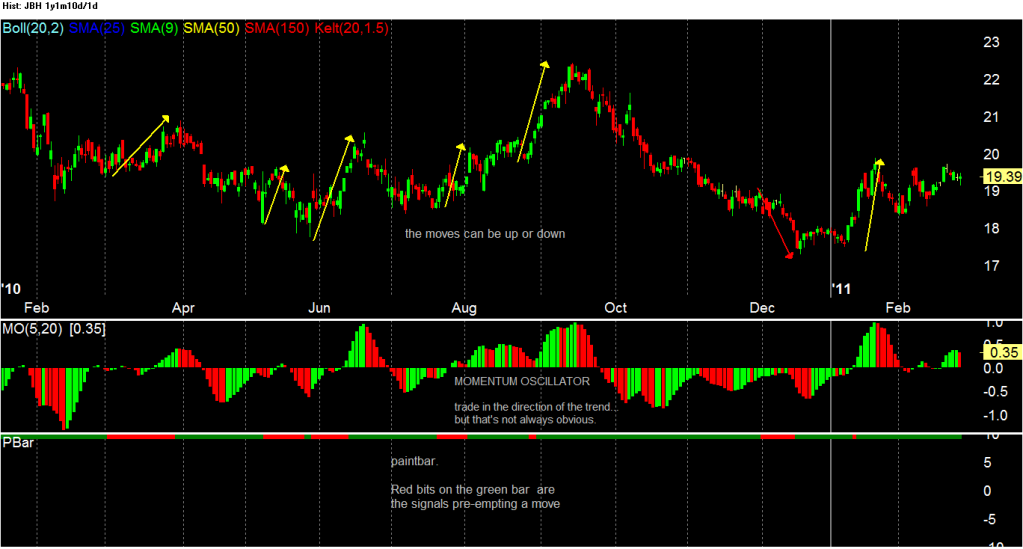
Anyway, here as promised the TTM Squeeze, developed by Trade the Markets, which they charge about $US 360 for, but free if your charting software supports a paintbar function.
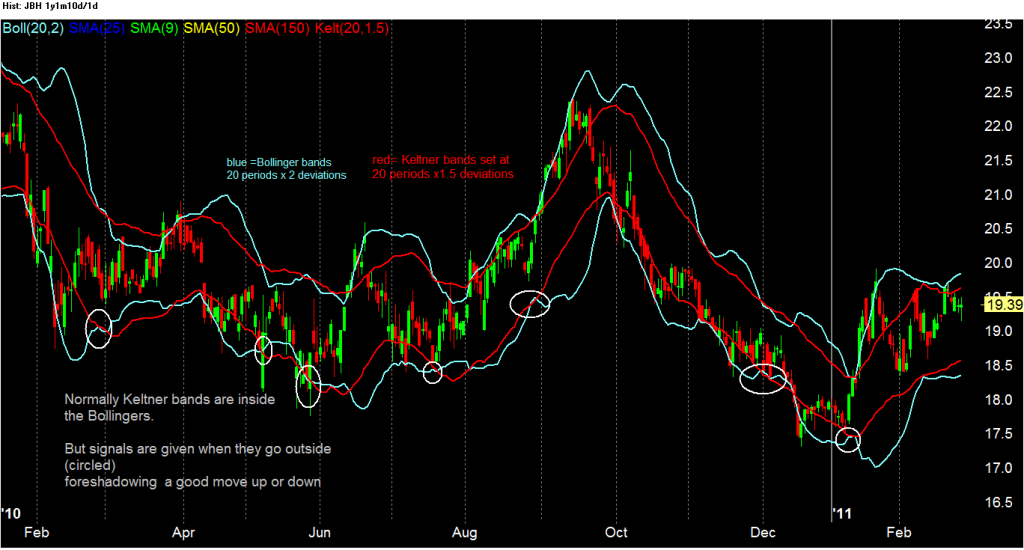
The key uppper indicators are Bollinger bands and Keltner bands....while the lower indicator needs the paintbar to give signals, and a momentum oscillator or similar to decipher whether to go long or short.
(It's the momentum oscillator I'm having trouble with, because it gives indistinct messages about whether the trend is up or down----maybe it is my inexperience with it?)
Once the indicators are in place, you can hide the bollinger and keltner bands to unclutter the chart.
This supposedly works on all time frames including intraday, better on some stocks and indices than others.
The example is for JB Hi Fi (JBH) daily....
- Forums
- ASX - By Stock
- XJO
- weekend charts
weekend charts, page-14
-
-
- There are more pages in this discussion • 39 more messages in this thread...
You’re viewing a single post only. To view the entire thread just sign in or Join Now (FREE)
Featured News
Add XJO (ASX) to my watchlist
 (20min delay) (20min delay)
|
|||||
|
Last
8,071.4 |
Change
0.200(0.00%) |
Mkt cap ! n/a | |||
| Open | High | Low |
| 8,071.2 | 8,071.4 | 8,008.9 |
Featured News
| XJO (ASX) Chart |
The Watchlist
UNT
UNITH LTD
Idan Schmorak, CEO
Idan Schmorak
CEO
Previous Video
Next Video
SPONSORED BY The Market Online


