And the thre peaks Domed House pattern update
From ze blog...
============================
M'kay,
been spraffing on about this pattern for some time, my "understanding" of the pattern has morphed as time goes on...
Pattern Summary:
It was originally noted and recorded as a pattern occurring on the Dow Jones... By One George Lindsay who noted occurrences during these times:
July 26, 1893 (point 1) to Sep 4, 1895 (point 23) in the Dow Jones 20 stock average.
July 26, 1910 (point 1) to Sep 30, 1912 (point 23) in the Dow Industrials.
October 1946 to November 1948
September 1964 to May 1966
October 9, 1966 to January 8, 1969.
I am taking this as verbatim as I have not researched these specific times.
In its idealised form it looks like this:
as part of the idealised form there is a specific time component mentioned which relates to points 14 through to 23 as 7 months and 8 to 10 days...
(mentioned on Thomas Bulkowski's Pattern Site)
Link to descrition on Bulkowski's site
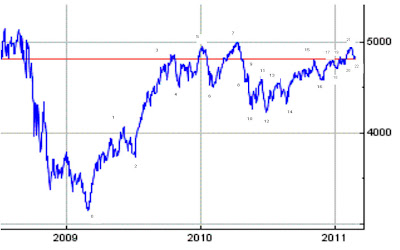
The following chart is the current XJO Daily chart with the low markded as 0 being the march lows.
(apologies for the chart quality I had to scrape this chart off the 'net and number it in Microsoft Paint so it is less than neat.)
The purpose of putting up the XJO chart is cos I have actually been using the conjectured numbering, Up till the current 22, to help me trade the SPI or IGMarkets representation of it (SPI being the Futures contract offered for the XJO index)
This is the current daily SPI chart (IGMarkets):
Note the original pattern was on the DOW INDEX, and looking at the XJO versus the SPI I beleive (after the fact) that the XJO count appears somewhat neater than that of the spi, with the spi going to extremes, for instance point 8, the May 6 "flash Crash" is the lowest low on the spi but only registers as a dip on the XJO as all that action occured whilst the XJO cash market was closed...
This is a very important at current times and levels, as the conjectured point 22 in the SPI chart looks outta wack, IE gone a bit low.. but XJO will not see an opening (barring a catastrophe in the next 10 hours) much below where it closed:
(futures suggest an opening of 18 pts above close on Friday)
Sooooo.... I am contending at this stage, conveniently based on the XJO that the pattern could still be alive...
Based on that... here is the current conjectured Future map based on this pattern... note I am conbining the channel marked with the thin lines with the potential pattern counts as a rough guide as to where price might go.
Time Factor
The brown horizontal arrow represents the above mentioned time factor for points 14 to 23 (the ultimate high in the pattern)
More detail in this previous post (link)
We'll see eh?
;)
- Forums
- ASX - By Stock
- XJO
- weekend charts
weekend charts, page-47
Featured News
Add XJO (ASX) to my watchlist
 (20min delay) (20min delay)
|
|||||
|
Last
8,285.2 |
Change
61.200(0.74%) |
Mkt cap ! n/a | |||
| Open | High | Low |
| 8,224.0 | 8,285.2 | 8,224.0 |
Featured News
| XJO (ASX) Chart |
The Watchlist
ACW
ACTINOGEN MEDICAL LIMITED
Will Souter, CFO
Will Souter
CFO
Previous Video
Next Video
SPONSORED BY The Market Online


