well said Rob !!! here's a quote from the ASX website...on how volume works in the futures markets and for that matter in stocks aswell .................
We can break the markets main participants into two groups, locals and other time frame traders or commercials. It would be nice to know what the commercials are doing, wouldnt it? If we knew which side of the market the commercials were coming from it would certainly give us an advantage. After all, at the end of the day, its probably the commercials that are responsible for any change in value. They really do move the market.
Commercial traders are big traders. They are typically large institutions like banks, brokers, hedgers, grain houses, mining companies, etc. Their nature is to trade in large clips, but not often, resulting in low volume overall. They look for a large profit or mark up and therefore lean toward the longer time frame. They are fortunate in that they can pick and chose when and at what price they get involved in the market. They dont have to trade on a daily basis. They have the capacity to carry large open positions and often do.
Locals or scalpers, on other hand, are the meat in the grinder. They are the short term traders, the speculators. Theyre the ones who facilitate trade, the price explorers, the ones the commercials can, get set too in a hurry. They trade large volume, in smaller clips, but more often, so their overall volume is high. They only trade for a couple of ticks and the profit per trade is therefore low. Their time frame is short term, often extremely short term. They almost always square up at the end of the day. They dont have an open position when the market closes, but they do trade everyday.
All the news is in the price.
Value is projected into the market by commercial traders, the other time frame traders. The commercials are privy to the industry relevant information and they make their move in the market before they tell the press. If there is no outside news to move price then they react to industry costs and recent market conditions.
Responsive activity versus Initiating Activity
If things are cheap, most people are naturally inclined to be buyers. Commercial traders, other time frame traders, are exactly the same. If prices are high, above value, commercial traders are more inclined to be active sellers. This is normal activity. This is responsive activity, higher prices attract sellers and lower prices attract buyers.
Locals on the other hand dont really care where they trade. They trade everywhere, at every price, in any direction they perceive might give them an advantage. Their concept of value is often extremely short term.
I monitor the commercial activity by using reference points . to follow the markets output ..to see where we are in relation to where we have been.it is almost impossible to be certain how the volume gets set untill after the fact . however that dosent mean you can't work with it .I look at a rage of data rather than specific price action to get a crearer picture . ie ..you never know how many sheep you have in the paddock untill you get them in the yards and count them ..
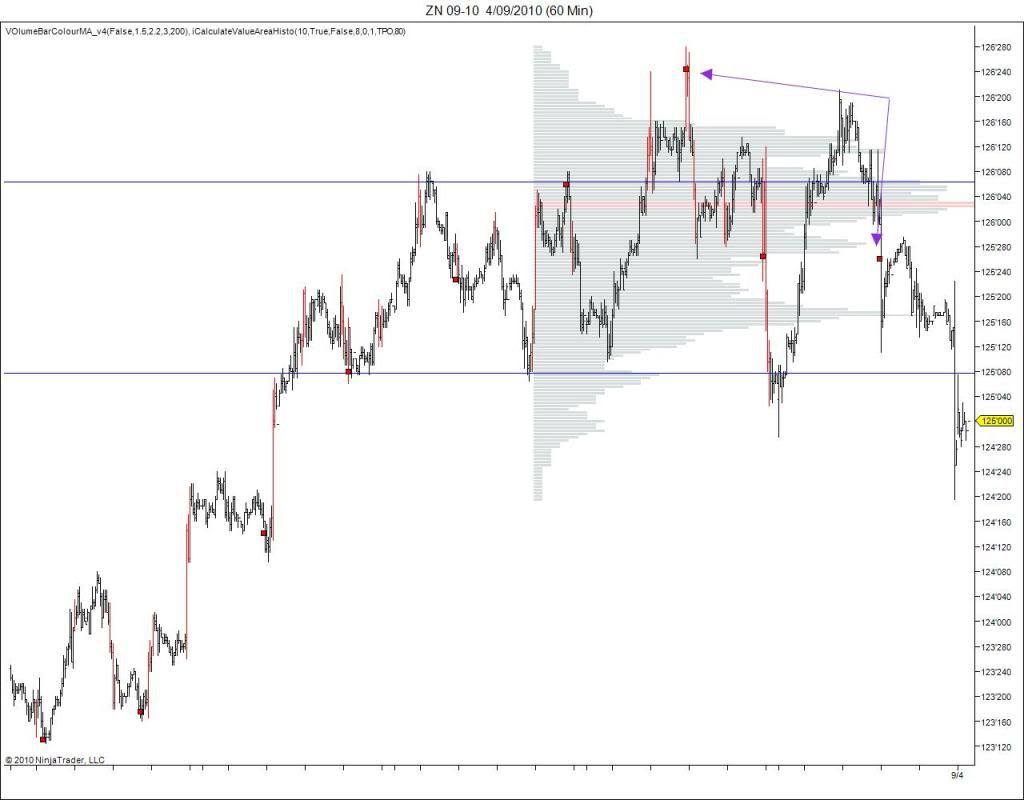
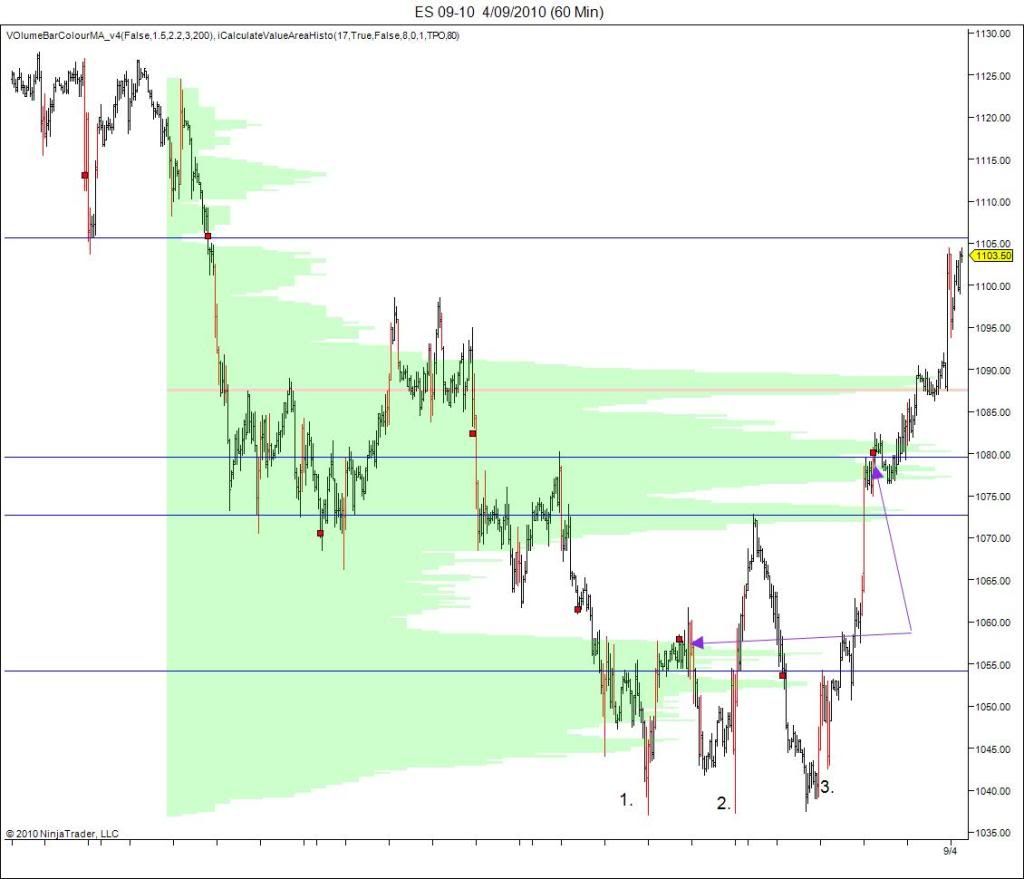
The charts below .. highlight the bars in red that record 3x the 200 bar ma...and it shows where the commercial traders are most likely to be trading.You can see on many occasions they move the market directionally, and I caan see the out put from the reference points.It also shows how the big volume rules . when big volume holds levels it's a great re assurance if you are set in the same direction.
The current condition over all is side ways and at extremes we see the market advertise prices to attract opposite commercial activity . it is possible that there is the beginning of a trend change in the US treasuries but it is unconfirmed yet ..the same can be said for equities.


- Forums
- ASX - By Stock
- weekend thread.
well said Rob !!! here's a quote from the ASX website...on how...
-
- There are more pages in this discussion • 57 more messages in this thread...
You’re viewing a single post only. To view the entire thread just sign in or Join Now (FREE)
Featured News
Add XJO (ASX) to my watchlist
 (20min delay) (20min delay)
|
|||||
|
Last
8,255.6 |
Change
-10.600(0.13%) |
Mkt cap ! n/a | |||
| Open | High | Low |
| 8,266.2 | 8,266.2 | 8,215.8 |
Featured News
| XJO (ASX) Chart |
The Watchlist
I88
INFINI RESOURCES LIMITED
Charles Armstrong, MD & CEO
Charles Armstrong
MD & CEO
Previous Video
Next Video
SPONSORED BY The Market Online


