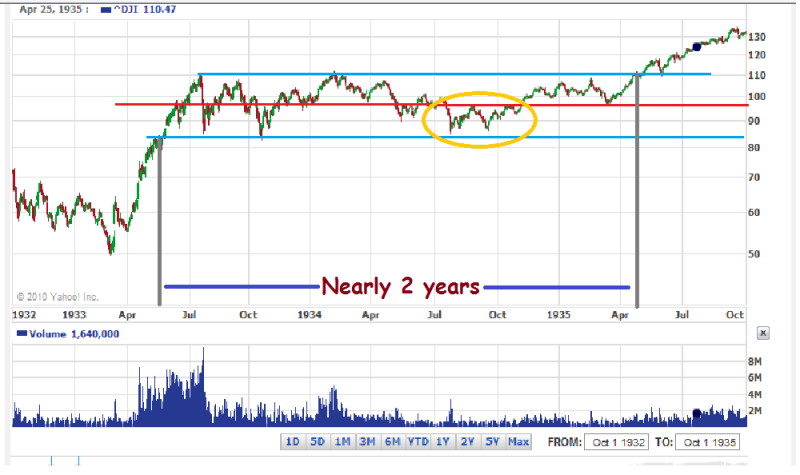
last week I posted on how the XJO had broken down from a sidways channel to an equal lower sideways channel and was possibly about break back up to the top channel again.....and it has all happened before. Below is a comparision of the XJO today and the DOW of the 1930s. I used to think of the period early 1933 to 1937 as a cyclical bull within a secular bear but breaking that period down even further we have.....a few months of corrective bounce after the massive fall of 1929 to 1932, then a sidways action that lasted the best part of 2 years and then a bull phase of about 2 years up to the 1937 peak. The modern day action on the XJO has been eerily similar to date. Note the circled areas in the lower channels.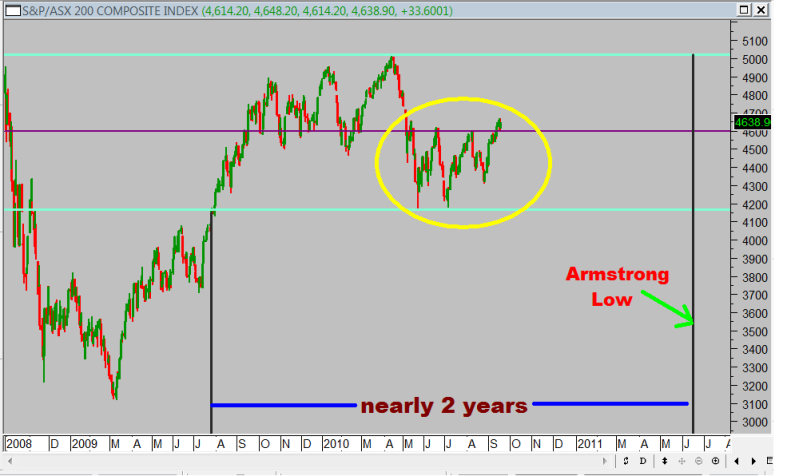
last week I posted on how the XJO had broken down from a sidways...


Add XJO (ASX) to my watchlist
 (20min delay) (20min delay)
|
|||||
|
Last
7,953.2 |
Change
-36.400(0.46%) |
Mkt cap ! n/a | |||
| Open | High | Low |
| 7,989.6 | 7,989.6 | 7,894.3 |
| XJO (ASX) Chart |