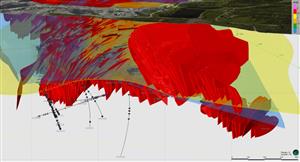
Its intetesting to note that even on a 5 year chart, which shows the ongoing fall from 80c at the start, the volumes currently trading appear to be way above average for that entire period. Maybe shows that things are beginning to wake up. With the massive volumes changing hands and the relatively low number of shares on issue (240 million according to Huntleys) hopefully new holders will lock them in and things will get going. If no new shares are issued in the near future this will have potential for a big move on a good earnings deal.
The rounded bottom of the recent low must also be a good sign that the downtrend is done?
Its intetesting to note that even on a 5 year chart, which shows...


Add to My Watchlist
What is My Watchlist?
 (20min delay) (20min delay)
|
|||||
|
Last
$1.36 |
Change
-0.005(0.37%) |
Mkt cap ! $790.3M | |||
| Open | High | Low | Value | Volume |
| $1.35 | $1.36 | $1.29 | $527.1K | 402.6K |
Buyers (Bids)
| No. | Vol. | Price($) |
|---|---|---|
| 4 | 2672 | $1.35 |
Sellers (Offers)
| Price($) | Vol. | No. |
|---|---|---|
| $1.37 | 2593 | 1 |
View Market Depth
| Last trade - 12.43pm 17/07/2025 (20 minute delay) ? |
| PYC (ASX) Chart |