I agree with Gullable but will throw these 3 up :)
Forgetting about the stain that is Wah Nam....
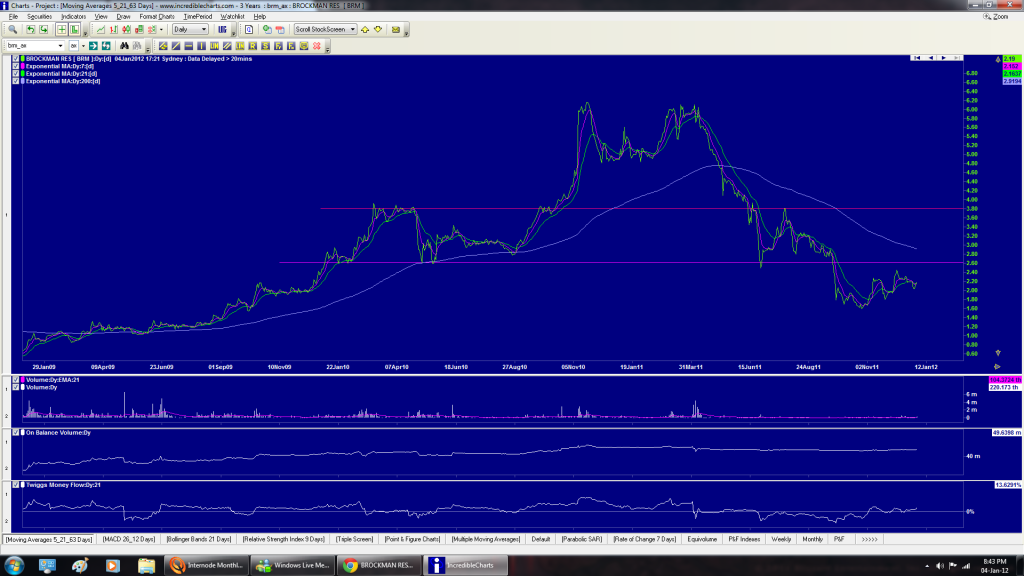
It turned into a bit of a head & shoulders pattern imo.
Once it fell through $3.60, it bounced around $2.60 which was proven support.After that broke...well you can see the result. In hindsight, perhaps when the indicators fell through the 200 day moving average ( $4.00 ) I should have bailed :)
The OBV and the Accumulation/Distribution have flatlined for the last year. I guess a large part of that would be because WNI & directors have a large portion of the shares tied up, so there's little volume to trade.
The multiple moving averages are starting to squeeze up which is good and I wouldn't be surprised to see the sp rally up to the resistance of $2.60 - $2.80 ( which by that time will also coincide with the 200 day MA )
NOW, taking into account WNI....who knows.
I do look at the accumulation/distribution chart though and still notice that from 2008 which the sp went from 40c to $6, it was rising ( naturally.) But since the churn of volume at $6.00 ( presumably by WNI's associates ) - the acc/dis line has moved sideways yet the share price has fallen from $6.00+ down to $1.50.
To me that just indicates that it has taken bugger all volume ( about 3Mil ) to get the sp to fall from those highs to lows. Manipulation some might say?
All in all, the indicators are starting to look..ok. With Wah Nam at the helm, the fundamentals and the new managements shady antics are less convincing than my tea leaves :/
I agree with Gullable but will throw these 3 up :)Forgetting...
Add to My Watchlist
What is My Watchlist?


