Hi Rennies and others,
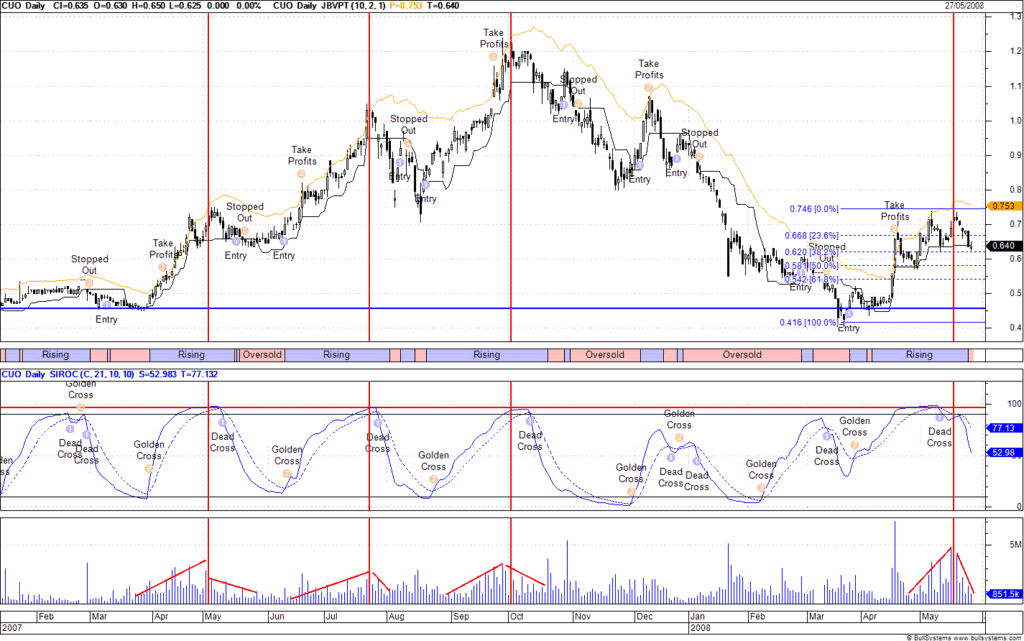
Have posted chart below. Unfortunately my reading of the charts are that the price still needs to drop a bit yet. Its all part of the cycle after a run up in price it gets overbought needs to blow off some steam. It starts dropping back people panic and the selling accelerates for a bit and it then gets oversold then the buyers move back in. A lot of the resource stocks are in the same position at the moment as they all had a run up and the whole sector is having a drop back.
I would be waiting to see SIROC lines drop close to the 10% line before buying in, as for what price that will be who knows, thought it might have some support at roughly 0.62, 0.58 and 0.54. Has taken out the first and close to the second. Its just wait and watch for a change in direction.
The market depth looks strong to the buy side but that doesnt seem to be much of an indicator.
THe weekly chart still seems good for longer term up.
Cheers Fero
- Forums
- ASX - By Stock
- CUO
- what does your chart say fero
CUO
copperco limited
what does your chart say fero , page-6
Featured News
Add to My Watchlist
What is My Watchlist?
A personalised tool to help users track selected stocks. Delivering real-time notifications on price updates, announcements, and performance stats on each to help make informed investment decisions.
Currently unlisted public company.
The Watchlist
VMM
VIRIDIS MINING AND MINERALS LIMITED
Rafael Moreno, CEO
Rafael Moreno
CEO
SPONSORED BY The Market Online


