There's a MXT / MOT 'Portfolio Update and Market Outlook' coming up. "Listeners are encouraged to submit questions ahead of time (by 31 March) to [email protected] "
Date:2 April 2020
Time AEDT:2:00 pm
Duration:60 minutes
Location:Online
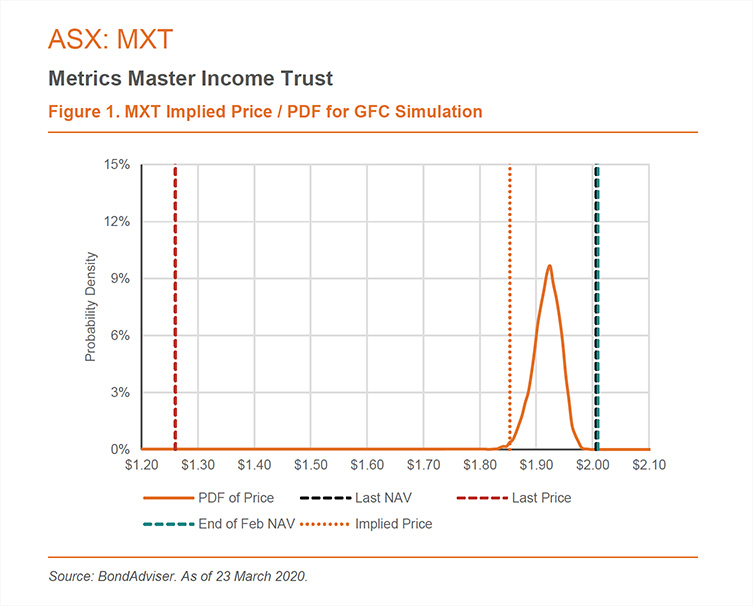
Also on the Metrics web site is this simulation by Bond Advisor based on GFC like conditions. Comes out positive, though the cynic in me wonders if it would have been used if it was negative.These curves and lines can seem odd, so to quickly refresh key points:
- Probability Density Functions (PDF), specify the probability of a simulation failing within a range of values. The integral space is equal to 1. The mode is the highest peak and the median is where the integral area (cumulative probability) is equal to 0.5. Our orange PDFs illustrate the simulation distribution for our worst-case GFC simulation.
- Our implied price, is a conservative estimate of where, based on GFC-like inputs, a LIT would be valued. Given the COVID-19 outbreak is a 1-in-100 event, our implied price looks at a 1% cumulative probability of simulations. Should the pandemic result in adverse credit migrations and loss given default (LGD) outcomes that are more severe than the GFC, the analysis is spurious for predictive purposes.
MXT provides exposure to the Australian corporate loan market. It has a net (after fees) target return of the RBA cash rate plus 3.25% p.a. We expect MXT to exhibit resilience to capital loss, given on a look-through basis, it contains >140 unique borrowers, mitigating the impact of any single adverse outcome. On 31 December 2019, average counter-party exposure by portfolio value was 0.7%.
About 45% of the portfolio by value is real estate based. Whilst comfortable with this given strict origination and guarantee requirements, our simulations may exhibit a high margin of error. This is because of a lack of explicit correlation. In the event of a severe property downturn, the probability and severity of default would be higher – this because we utilise GFC data that encompass the entire corporate universe, rather than data that is specific to the property industry during the GFC.
MXT benefits in our modelling given ~75% of loans are senior secured, deriving significantly better loss given default outcomes than bonds. It also benefits from a short average tenor (2.5 years), which, in the event of an adverse mark-to-market revaluation results is a smaller quantum of cashflows revalued with a higher discount rate.
At last price of $1.26, MXT appears to provide excellent value, given our worst-case GFC simulation price of $1.85 – representing a conservative upside potential of a 47% capital gain. It is not unreasonable to suggest that MXT may experience capital loss, but given its success in turnarounds, we expect the ultimate NAV impact to be insignificant.
There's a MXT / MOT 'Portfolio Update and Market Outlook' coming...


Add MXT (ASX) to my watchlist
 (20min delay) (20min delay)
|
|||||
|
Last
$2.08 |
Change
0.010(0.48%) |
Mkt cap ! $2.204B | |||
| Open | High | Low | Value | Volume |
| $2.06 | $2.09 | $2.06 | $5.612M | 2.708M |
Buyers (Bids)
| No. | Vol. | Price($) |
|---|---|---|
| 1 | 13000 | $2.07 |
Sellers (Offers)
| Price($) | Vol. | No. |
|---|---|---|
| $2.08 | 272687 | 9 |
View Market Depth
| Last trade - 16.10pm 03/05/2024 (20 minute delay) ? |

|
|||||
|
Last
$2.07 |
Change
0.010 ( 0.18 %) |
||||
| Open | High | Low | Volume | ||
| $2.07 | $2.08 | $2.06 | 322768 | ||
| Last updated 15.38pm 03/05/2024 ? | |||||
| MXT (ASX) Chart |