Hi people
Just thought I'd throw an updated chart of what we can maybe expect to see in the next week or 2 so anyone who doesn't believe that charts are of any benefit please look away now, this post is not for you lol.
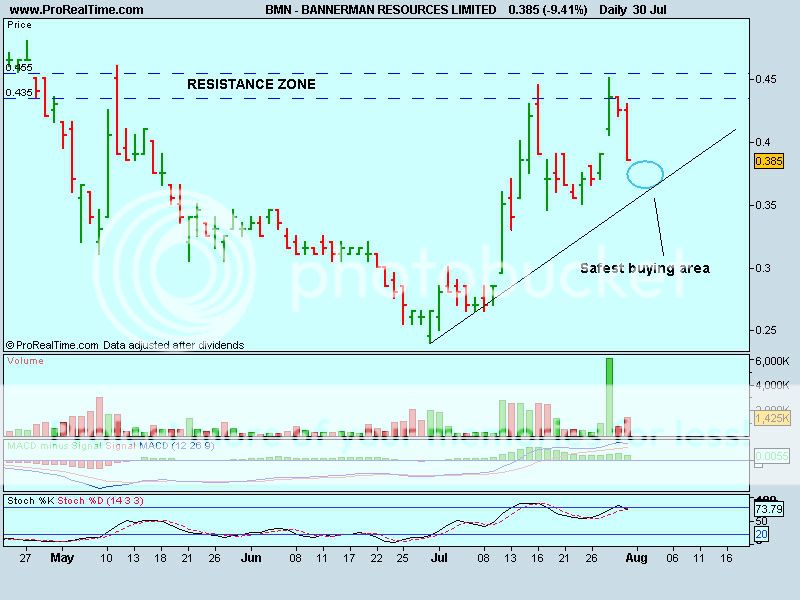
BMN, as we can see has run really well over the last couple of weeks and has made successive higher lows, and I think we can probably say the trend has changed. Though i'll be happier when that is fully confirmed on the weekly.
Now, notice the sp headed up to a high of 45c on very high volume on the 26th and look what happened since. As stated before days like this may be perceived as strong days because the price goes higher but they are in fact weak in that they enable the sellers to sell to the unwary at higher prices than they would like. Predictably after such a strong rise like this we have had the price come off and it'll now take a little while, until it gets far enough away from that weakness, for it to make another assault on that resistance zone which is full of sellers. These need to be eroded and will be by successive attempts on it. With each attempt the price should drop back slightly higher as more willing buyers come in on or near that support line and I would hazard a guess that maybe in a week or so we'll have a good triangle breakout which should propel us to the next resistance at 56c and beyond.
In the immediate short term that wide spread day on Friday on increased volume finishing on its low will IMO take us a little lower yet. The daily stochastic is confirming this at the moment as is the MACD which have turned down. However there is strength on these indicators on the weekly with the stoch and MACD heading up and indicating a new uptrend. The weakness we may see over the next few days though should also provide a good safe entry opportunity, and I've marked where that may be on the chart. A low volume narrow spread day near the line would be really nice.
Anyway we'll see what happens and as we know anything can happen but hopefully this puts a bit of perspective on the price movements re where they have come from and may be headed.
Cheers!
- Forums
- ASX - By Stock
- where we're at
BMN
bannerman energy ltd
Add to My Watchlist
1.16%
 !
$3.50
Hi peopleJust thought I'd throw an updated chart of what we can...
Featured News
Add to My Watchlist
What is My Watchlist?
A personalised tool to help users track selected stocks. Delivering real-time notifications on price updates, announcements, and performance stats on each to help make informed investment decisions.
 (20min delay) (20min delay)
|
|||||
|
Last
$3.50 |
Change
0.040(1.16%) |
Mkt cap ! $718.9M | |||
| Open | High | Low | Value | Volume |
| $3.37 | $3.56 | $3.37 | $14.32M | 4.085M |
Buyers (Bids)
| No. | Vol. | Price($) |
|---|---|---|
| 1 | 500 | $3.49 |
Sellers (Offers)
| Price($) | Vol. | No. |
|---|---|---|
| $3.54 | 1000 | 1 |
View Market Depth
| No. | Vol. | Price($) |
|---|---|---|
| 1 | 500 | 3.490 |
| 1 | 160 | 3.400 |
| 1 | 1474 | 3.370 |
| 1 | 6060 | 3.300 |
| 1 | 481 | 3.290 |
| Price($) | Vol. | No. |
|---|---|---|
| 3.630 | 8771 | 1 |
| 3.640 | 1123 | 3 |
| 3.650 | 3000 | 1 |
| 3.690 | 2800 | 1 |
| 3.740 | 2800 | 1 |
| Last trade - 16.10pm 19/09/2025 (20 minute delay) ? |
Featured News
| BMN (ASX) Chart |


