Chart below shows we're holding support but also respecting a fairly short term downtrend line at the moment. Volume only 5M at the moment which is very low for half way through the day.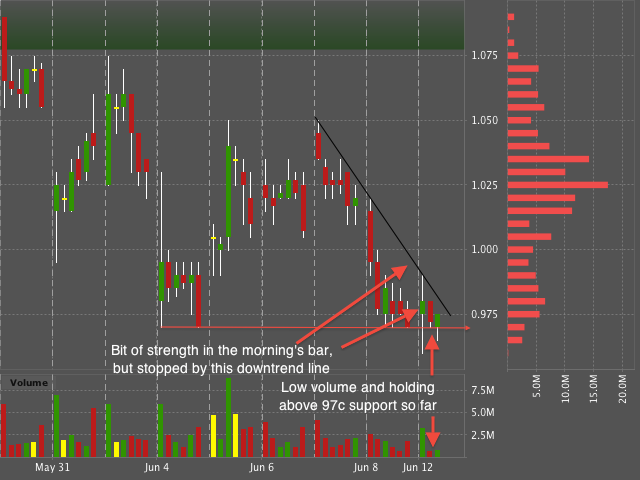
Another thing I found quite interesting is our current trading range looks quite similar to the one from mid-2007 to mid-2008. Amazing to think Lynas was at the same price with no LAMP and <$10 basket price.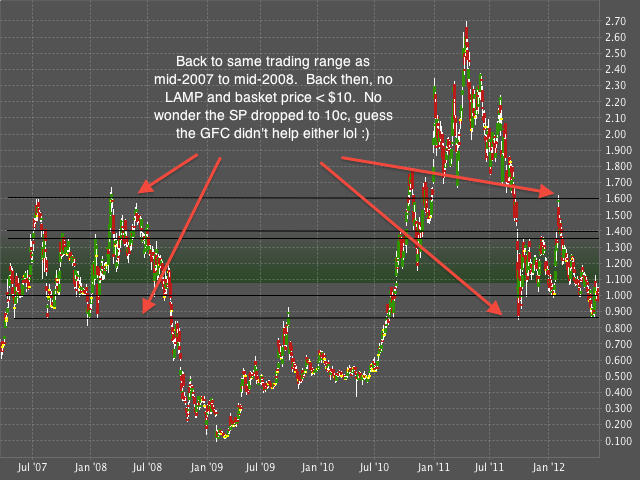


Add to My Watchlist
What is My Watchlist?
 (20min delay) (20min delay)
|
|||||
|
Last
$10.14 |
Change
0.020(0.20%) |
Mkt cap ! $9.485B | |||
| Open | High | Low | Value | Volume |
| $10.14 | $10.25 | $10.02 | $65.63M | 6.468M |
Buyers (Bids)
| No. | Vol. | Price($) |
|---|---|---|
| 2 | 700 | $10.10 |
Sellers (Offers)
| Price($) | Vol. | No. |
|---|---|---|
| $10.15 | 500 | 1 |
View Market Depth
| Last trade - 16.14pm 23/07/2025 (20 minute delay) ? |
| LYC (ASX) Chart |