If one looks at the S&P500 daily, it seems to me that the last 3 or 4 weeks are turning into an upward tilting distribution / creeping or struggling move up. If that is what it is, it would ordinarily be followed by a fast move down.
That seems to me to be a larger version of the same pattern that appeared at the June top.
The upward titling distribution there went on for two weeks and ended after an outside day finishing down followed by a day which went to a new high but finished way off the high for the day and marginally up from the day before. That new high day was the June top.
The last 2 days here have been very similar - so close to a replication that it is a bit too obvious for a top to me. But it is what it is.
Got chopped up and whipsawed out of my short on Friday but am undeterred and looking for another entry.
I have my set up on the daily, now I'm watching the 30 minute and when I get a signal there I'll move down to the 1 or 2 minute and when I get a signal there, I'll try again.
Made some $$ on the SPI this morning short and then small scalp long (past experience has shown me that when I take a long like I just did it is unually time for the market to turn down in a big way) so that lessened the damage from Friday.
What has me a bit cautious is that the rectangle on Friday turned into a triple bottom (see ovals in chart below) and then overnight there is a double bottom at a lower level (see ovals). Those suggest strength, but the daily overpowers that so getting ready to load 'em up again.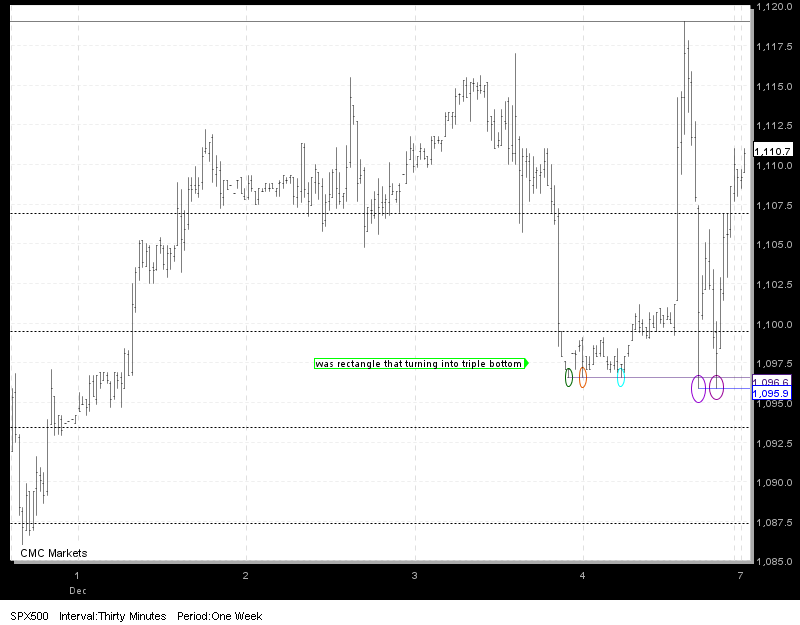
which way monday, page-33


Add XJO (ASX) to my watchlist
 (20min delay) (20min delay)
|
|||||
|
Last
8,214.5 |
Change
-8.500(0.10%) |
Mkt cap ! n/a | |||
| Open | High | Low |
| 8,223.0 | 8,228.3 | 8,200.0 |
| XJO (ASX) Chart |