Hello all,
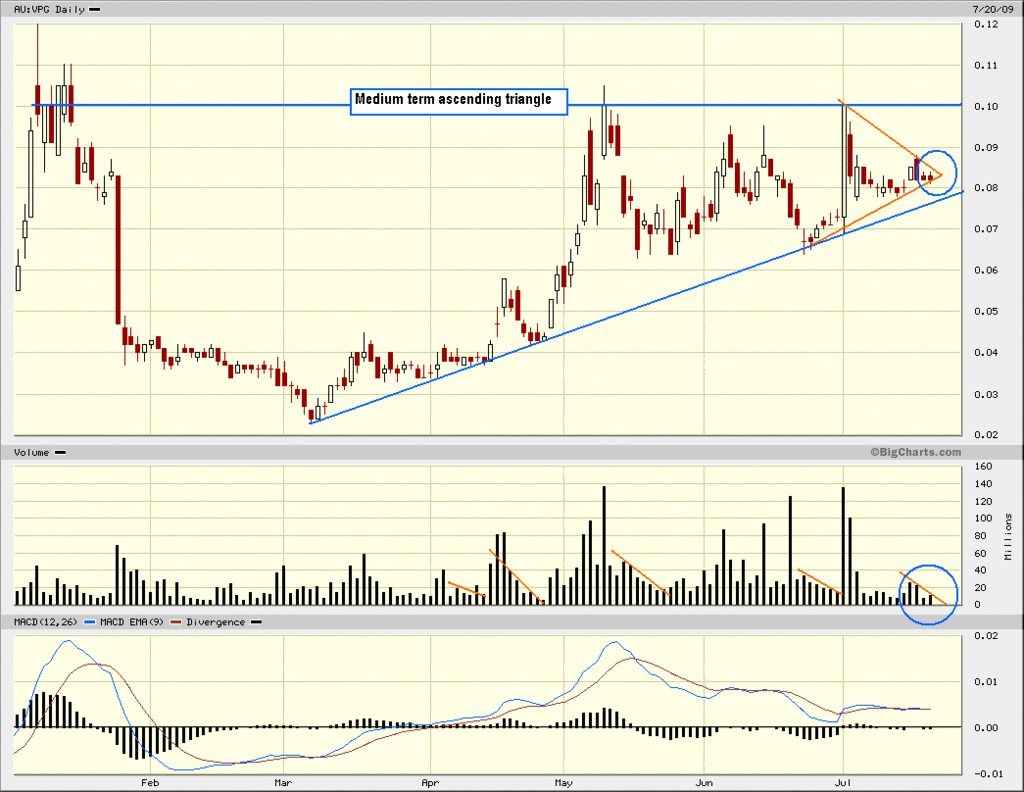
This stock has been on my radar - technicals in my opinion are looking interesting. I've attached a chart so that you get an idea of what I'm looking at. Over the medium term VPG is developing into a classic bullish textbook ascending triangle pattern (in blue). Hence, on that basis, price projections place the share price somewhere in the upper teens.
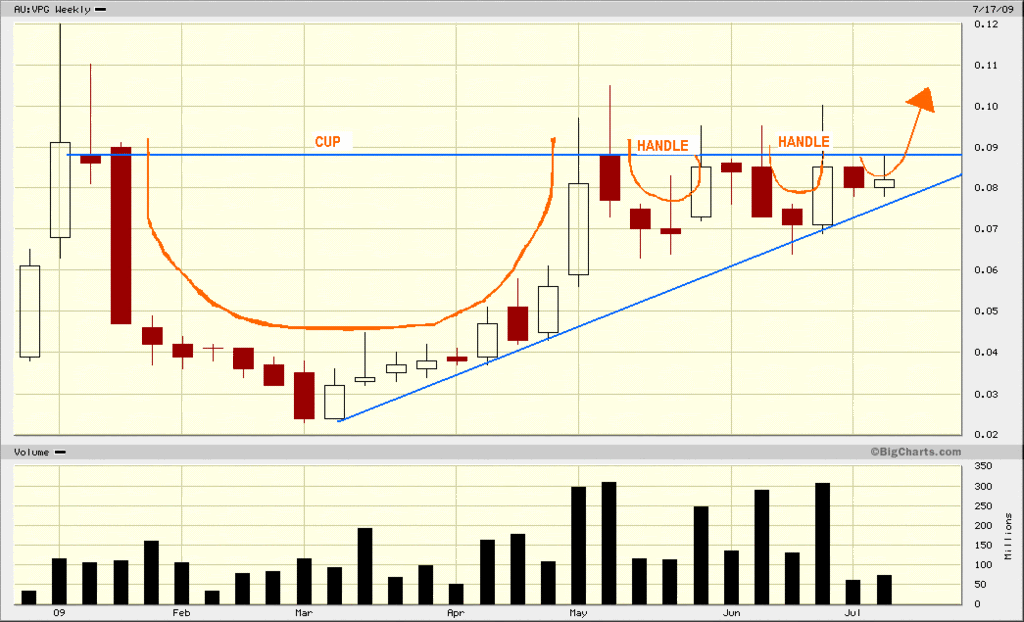
Inspection of the weekly chart (bottom chart) clearly supports an ascending triangle pattern. Intertwined in that pattern is a classic 'Cup & Handle' pattern (well multi-handle) which further supports the potential for a bullish breakout pattern.
In the short term volume has subsided substantially, which if you scan back over the previous few months in the top chart I've highlighted areas of volume consolidation (in orange) before the follow-on of reasonable movements in share price. This typically happens in this stock and many others before a break out (either up or down).
VPG looks to be at one of those critical points now (blue circles). In my view, I believe we will see some significant gains on the board very soon, BUT, I only say that because I'm personally bullish on this stock. Although, as always, patience will be rewarded in good time. Happy to hear others' opinions. Good luck with your trades.
cheers
Sagitar
nb. PDYOR

Weekly share price

- Forums
- ASX - By Stock
- VPG
- robust bullish pattern in play
robust bullish pattern in play
Featured News
Add VPG (ASX) to my watchlist
 (20min delay) (20min delay)
|
|||||
|
Last
$1.79 |
Change
0.000(0.00%) |
Mkt cap ! n/a | |||
| Open | High | Low | Value | Volume |
| 0.0¢ | 0.0¢ | 0.0¢ | $0 | 0 |
Featured News
The Watchlist
LU7
LITHIUM UNIVERSE LIMITED
Alex Hanly, CEO
Alex Hanly
CEO
SPONSORED BY The Market Online


