"well going by recent tech.movement the charts have never lied on this one since it sailed under 93c."
Just had a quick look at the chart. I didn't see it. Can you provide a retrospective description or chart to support?
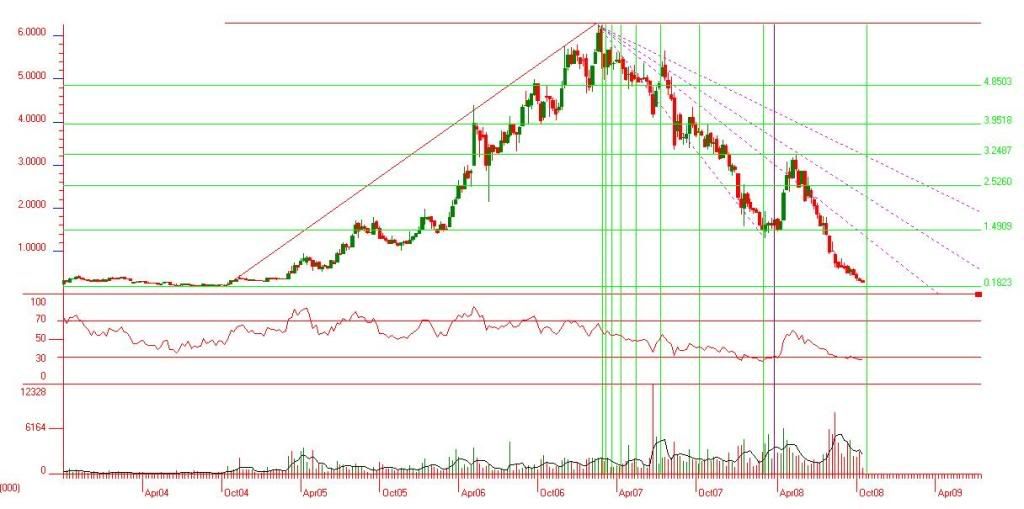
I have been waiting patiently for an entry point around this region but cannot make out any decent level higher than 18.5c, the long term support.
The time expansion in the following chart has had reasonable success with predicting minor tops and bottoms, and suggests a turn within the next week or two with resistance around 60c. Also note that last time the RSI came up through the 30 line the SP spiked significantly (blue vertical line).
Thanks
CMR Price at posting:
24.0¢ Sentiment: LT Buy Disclosure: Not Held