Not really an area I look at much but here is the Dollar Index daily and there is something interesting on the chart that I thought I might point out as it could have implications for the short term direction of the stock indices. Notice there was an exact higher double bottom (HDB) at 73.515. Now the chart I posted earlier of the HDB on the ES today shows what should happen after a HDB if there is the slightest strength in a market. Well what we got after this HDB is nada, zip, a very muted response. That suggests to me that this index is rather weak and I would expect the level of the HDB to go very soon and perhaps there might be a mini capitulation here. If that happened, and the inverse relationship between this index and the stock indices stayed true, there would be some bullishness on the stock indices. Lots of if and buts in there but I thought it was worth a mention.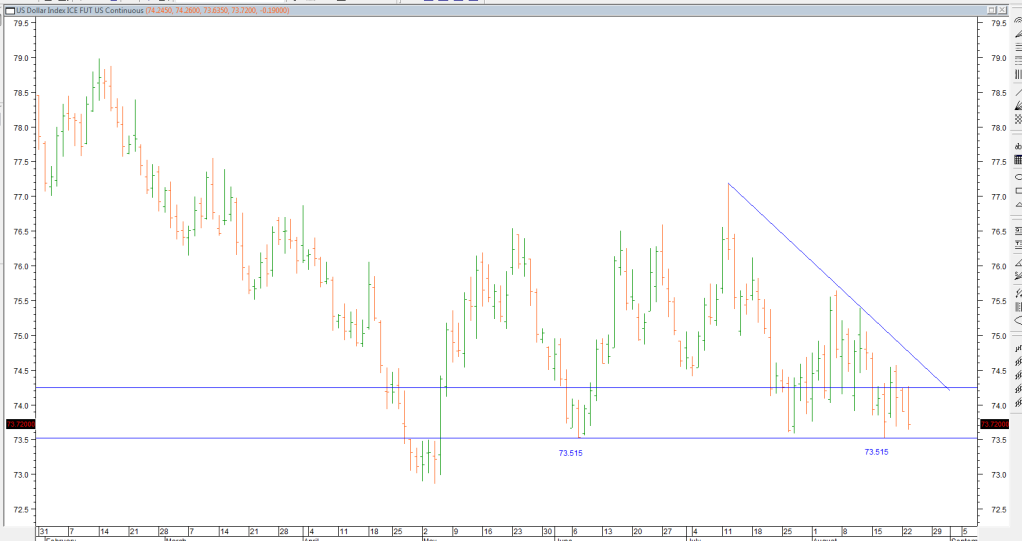
wodger raters tuesday, page-75


Add XJO (ASX) to my watchlist
 (20min delay) (20min delay)
|
|||||
|
Last
7,816.8 |
Change
-12.900(0.16%) |
Mkt cap ! n/a | |||
| Open | High | Low |
| 7,829.7 | 7,829.7 | 7,782.0 |
| XJO (ASX) Chart |