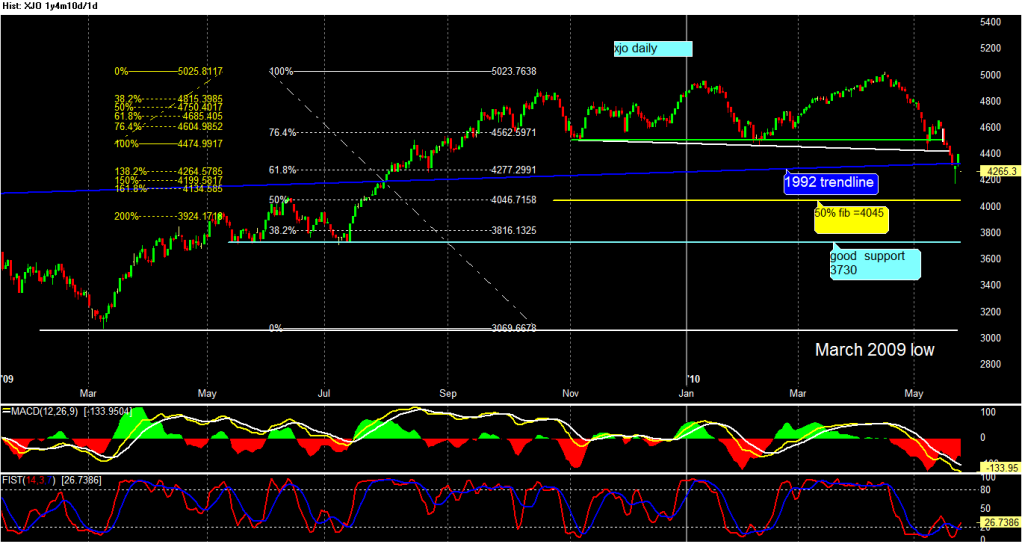
XJO has fallen through a log chart trendline going back to 1992, with touch at 2003 (blue line).
Of course we are also below the February low, which the USA isn't but may reach tonight -- if futures are to be believed..
XJO is at:
- minus 138.2% fib extension of February 2010 low/April high
-61.8% fib March 2009 low/April high
So, crunch time...
- Forums
- ASX - By Stock
- XJO
- woeful tuesday
woeful tuesday, page-117
-
-
- There are more pages in this discussion • 28 more messages in this thread...
You’re viewing a single post only. To view the entire thread just sign in or Join Now (FREE)
Featured News
Add XJO (ASX) to my watchlist
 (20min delay) (20min delay)
|
|||||
|
Last
7,989.6 |
Change
68.300(0.86%) |
Mkt cap ! n/a | |||
| Open | High | Low |
| 7,921.3 | 8,000.0 | 7,921.3 |
Featured News
| XJO (ASX) Chart |


