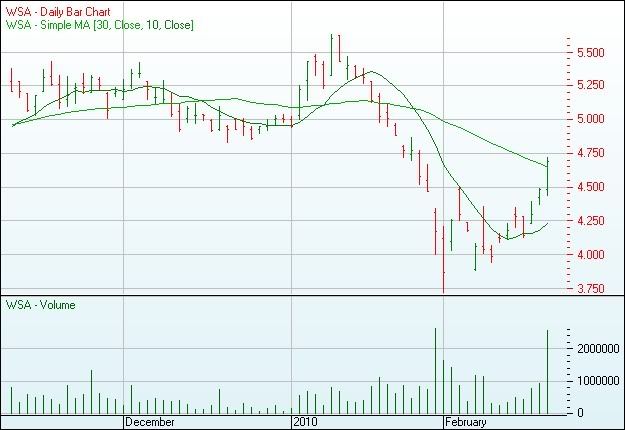
The WSA ohlc chart is above
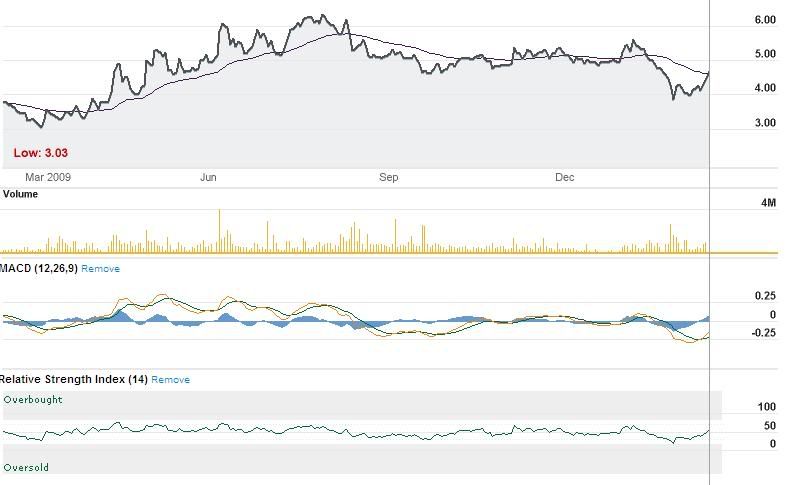
The WSA rsi & macd is above
_________________________________________________________
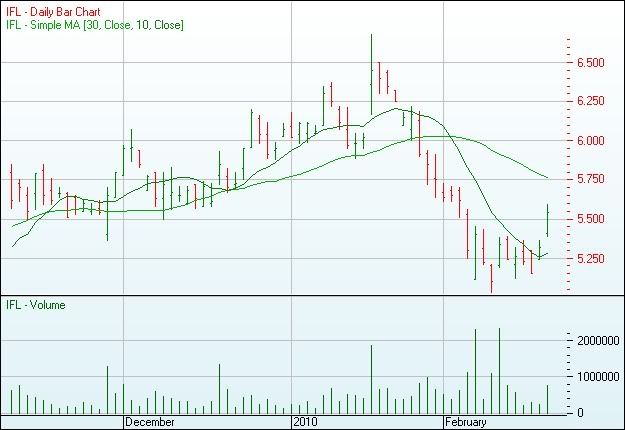
The IFL ohlc chart is above
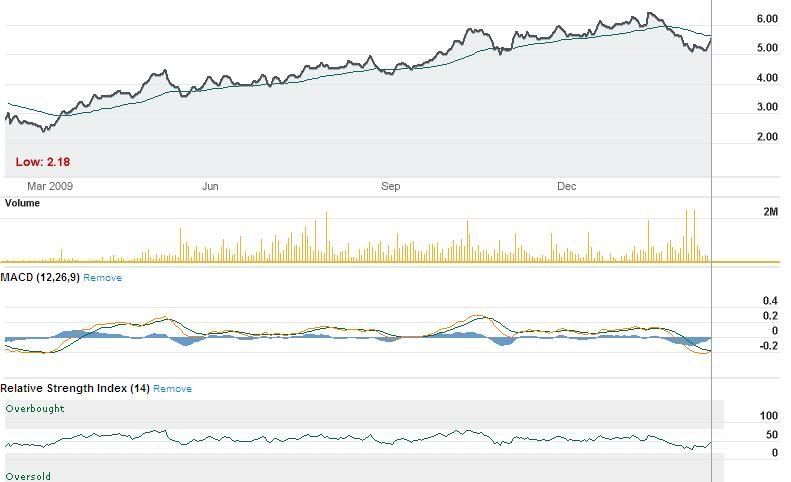
IFL rsi & macd
___________________________________________________________
Question from beginner: based on the charts, which will do better in the short term?
Both closed above the 30 day moving average and the 10 day moving average. WSA closed above the 41 EMA whereas IFL closed just below it. However, I think IFL has a better chart from the MACD perspective.
What do others think?
Cheers.
- Forums
- General
- wsa v ifl - which will do better in short term


