The first chart here I have put up before. It highlights reasons why I believe 8/10/2010 will be a major turn....probably a low. Some reasons are astrological and some are based in fibonacci.....
the second chart I have just whipped up now and expands on the ideas in the first. We see that not only is fib/Gann 144 months at work but also is there is a 2:3 fibonacci ratio thing happening as well.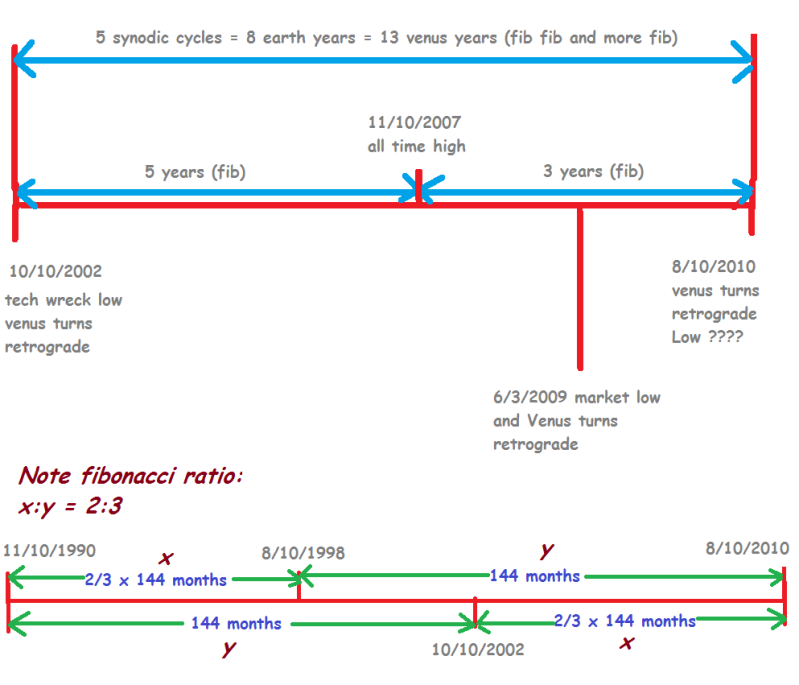
The first chart here I have put up before. It highlights reasons...


Add XJO (ASX) to my watchlist
 (20min delay) (20min delay)
|
|||||
|
Last
7,959.3 |
Change
69.700(0.88%) |
Mkt cap ! n/a | |||
| Open | High | Low |
| 7,889.6 | 7,969.1 | 7,889.0 |
| XJO (ASX) Chart |