S&P500 commentary 12.01.12
DAILY CHART
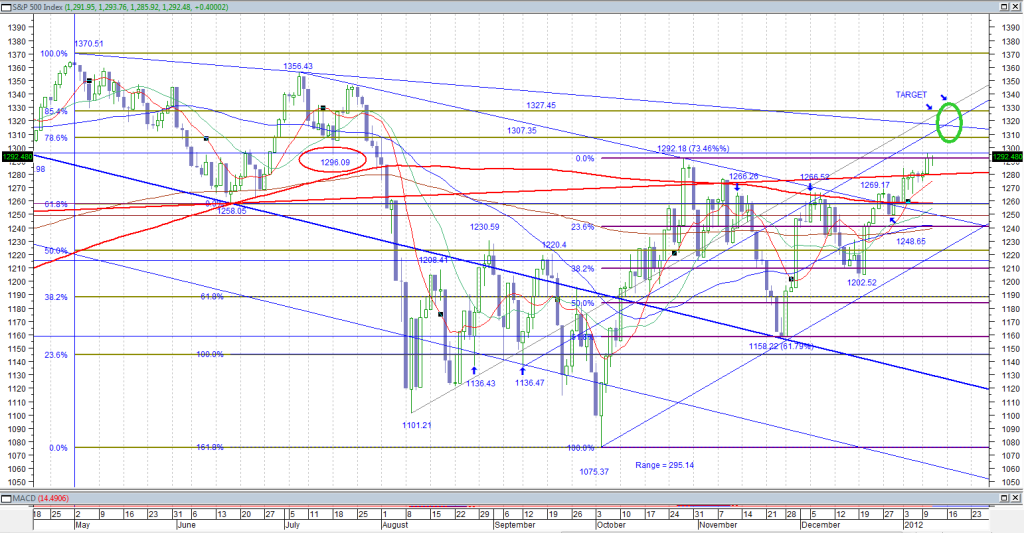
The daily is clearly in an uptrend and there is no indication of the trend reversing.
Late in December the index came up for the 4th attempt at the 200 simple moving average (sma) (curved thick red line). The 4th attempt at support of resistance usually carries the probability of moving through that support or resistance and this time the usual happened. The index consolidated at the 200 sma during the Christmas / New Year period, and then on the first trading day of the year, moved up out of that colsolidation to the next resistance, being the trend line formed from the neckline of the head and shoulders topping pattern from 2011 (straight thick red line). The index then spent the next 4 days consolidating at that level before moving up for the second significant up day of the year on Tuesday this week. That day, the index put in a high at 1296.05, being 0.04 of a point off the low made 18 July 2011. The index then retreated to close at 1292.08. Note the level of the October 27 High was 1292.18 so the close was 0.1 of a point below that level. Overnight the trading range was small at 7.84 points. It did some successful downside testing and was limited to the upside with a close at 1292.48, up 0.3 of a point and the first close above the October high of 1292.18.
It is usual for sharp moves to come off the 200 sma. Due to the fact the index now appears to have moved through the 200 sma, the usual outcome would be a strong move away from the 200 sma. That move appears to have started on the first trading day of the year.
RETRACEMENTS AND MEASURED MOVES UP
The range from the November low (1158.22) to the December high (1266.52) was 108.3 points. A measured move from the December low (1202.52) would take the index to 1310.82.
The range from the October low (1075.37) to the October high (1292.18) was 216.81 points. A measured move from the November low (1158.22) would take the index to 1375.03. That level seems outside the bounds of what would be likely for this move up, although having said that, the target for the inverse head and shoulders pattern is 1374 which is a match. Don’t rule out a move to that level for a marginal new high.
The retracement from the October high was 61.79% of the October move up.
The Retracement from the December high was 59.10% of the November/December move up.
From 19 December to 27 December there was a 66.65 point move up and then a 1 day fall into a low on 28 December of 20.52 points high to low. That was a 30.79% retracement of that late December move up.
A measured move of 66.65 points from the low on 28 December would take the index to 1315.30.
The retracements are less and less indicating a strengthening move up. Ideally, the retracements would be measured down from higher highs as the trend progresses however in this instance, the October high was higher than both the early and late December 2011 highs. The late December high was however, higher than the early December high.
There is no evidence of a weakening trend from the November low. Rather, the trend appears to be strengthening.
PRESENT AND UPCOMING RESISTANCE
Present horizontal resistance is the 27 October 2011 high (1292.18) and the 18 July 2011 low (1296.09).
Upcoming horizontal resistance is 78.6% Fibonacci retracement of the 2011 bear trend (1307.35) and 85.4% Fibonacci retracement of the same range (1327.42).
Other significant overhead resistance is the descending trend line from the highs made 7 July 2011 and 25 July 2011 which comes out at the following prices on the following days:
12 January 2012 – 1316.44
13 January 2012 – 1316.11
16 January 2012 – 1315.73
17 January 2012 - 1315.44
That descending trend line is decreasing in value at a rate of 0.30609 points per day and I will update the above value each day for the next 4 trading days if necessary.
65 MINUTE CHART
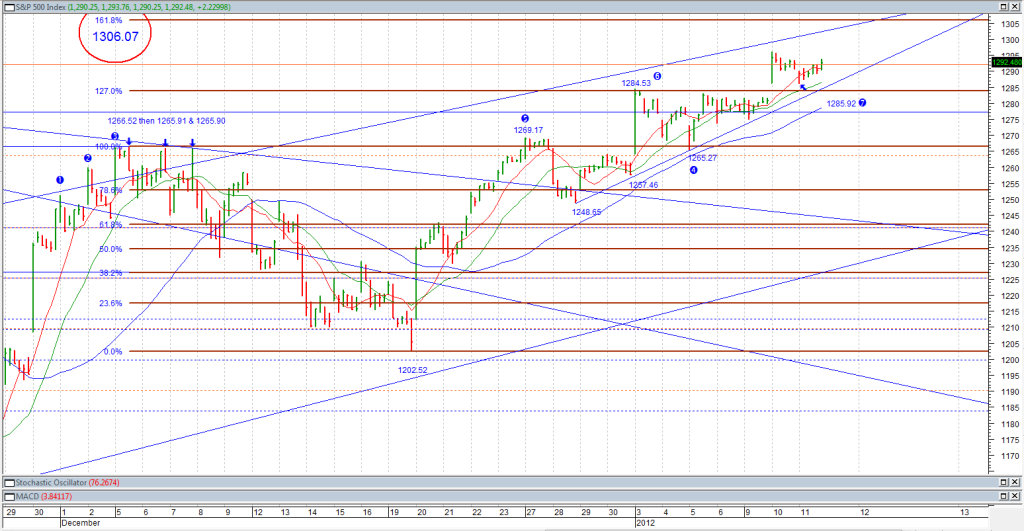
I posted this chart yesterday with some comments about the potential for a move to the 161.8% extension of the range from the December high to the December low. I conside a move to that level is probable.
Note also here that the move down at the open on 5 January 2012 to the price 1265.27 (“4”) only marginally breached the level of the prior swing high at the open on 27 December at 1269.17 (“5”). The index recovered the level of the prior swing high within the next hour and a half.
Of much importance is how price dealt with the level of the prior swing high overnight. The prior swing high was the spike at the open on 3 January 2012 (“6”) at 1284.53 and the low this last session was 1285.92 (“7”) leaving space between that prior high and the overnight low of 1.39 points.
So we have moved from a prior swing high being breached by 3.9 points (“4” and “5”) to the index leaving 1.39 point of space between the prior swing high and most recent swing low (“6” and “7”). This suggest support coming in a at high level and an uptrend that is accelarating or strengthening.
Presently, the nearest supports are last sessions low (1285.92); the ascending trend line through the December and January lows and the 3 January high (1284.53) which also coincides with the 127% Fibonacci level from the December range (1283.8).
15 MINUTE CHART
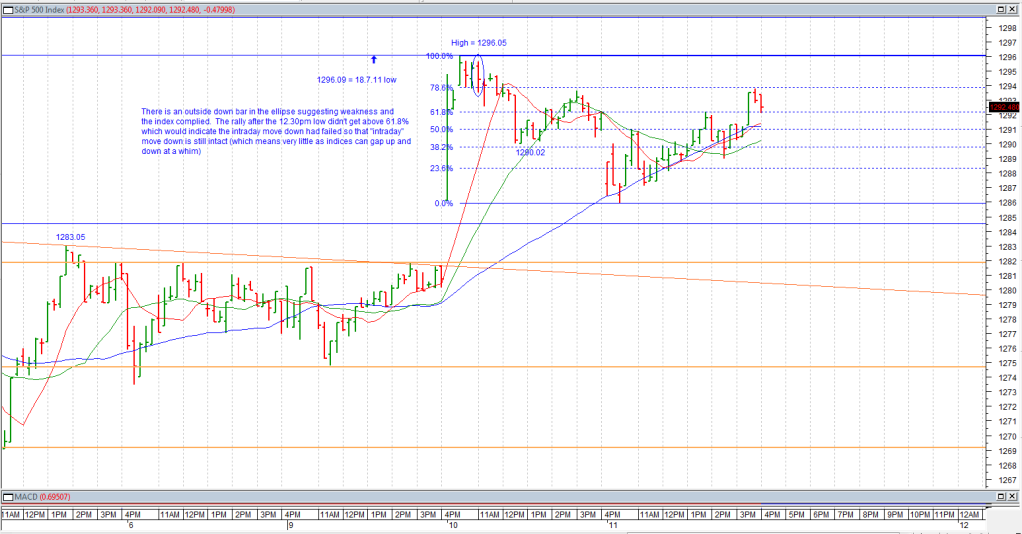
This chart was posted yesterday. I am reposting it as yesterday I noted that the index had failed in the move up from yesterday's intraday low at a 61.8% retracement suggesting that the move down remained intact. Overnight the 61.8% level was taken out with consistant support from the 50 sma, and the index moved to the 78.6% level before pulling back slightly into the close (notice support at the 61.8%). That suggests that the move down from Tuesday's high has failed keeping the overall move up looking healthy.
5 MINUTE CHART
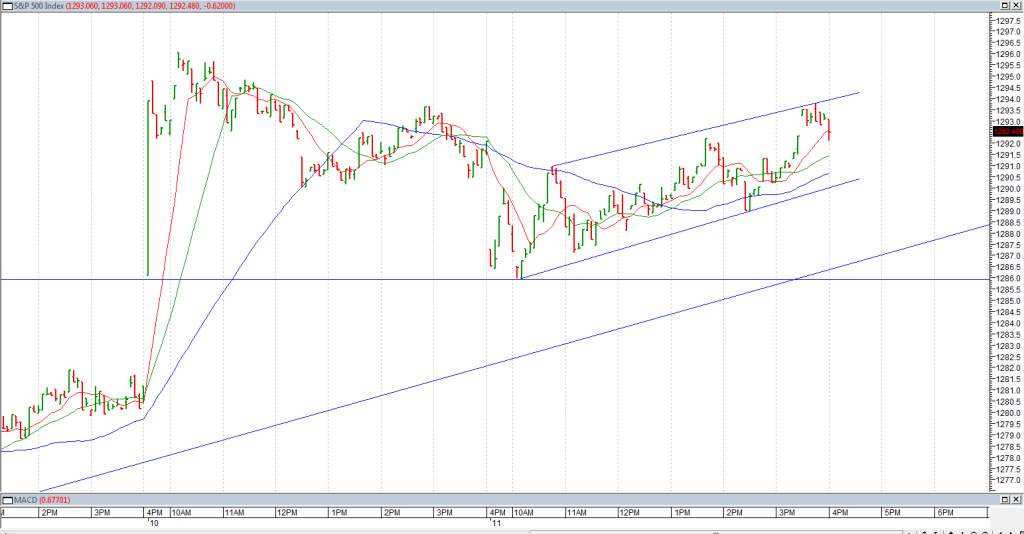
Nothing is ever clear cut and you can see here that there is a clear bear flag formed below the high at the open on Tuesday. The larger the time frame, the more significance the pattern is given so this pattern appearing here is far from fatal for the move up although it needs to be watched carefully.
While the overnight low holds, and there remains the space between the current low and the prior swing high, the move up remains in a strong position. The first problem will appear is that level gets taken out to the downside.
CONCLUSION
The move up is strengthening while the prior swing high of 1284.53 holds.
- Forums
- ASX - By Stock
- XJO
- xjo el capo's iced vovo thursday
xjo el capo's iced vovo thursday, page-56
-
- There are more pages in this discussion • 54 more messages in this thread...
This thread is closed.
You may not reply to this discussion at this time.
You’re viewing a single post only. To view the entire thread just sign in or Join Now (FREE)
Featured News
Add XJO (ASX) to my watchlist
 (20min delay) (20min delay)
|
|||||
|
Last
7,957.0 |
Change
-146.200(1.80%) |
Mkt cap ! n/a | |||
| Open | High | Low |
| 8,103.2 | 8,103.2 | 7,939.4 |
Featured News
| XJO (ASX) Chart |


