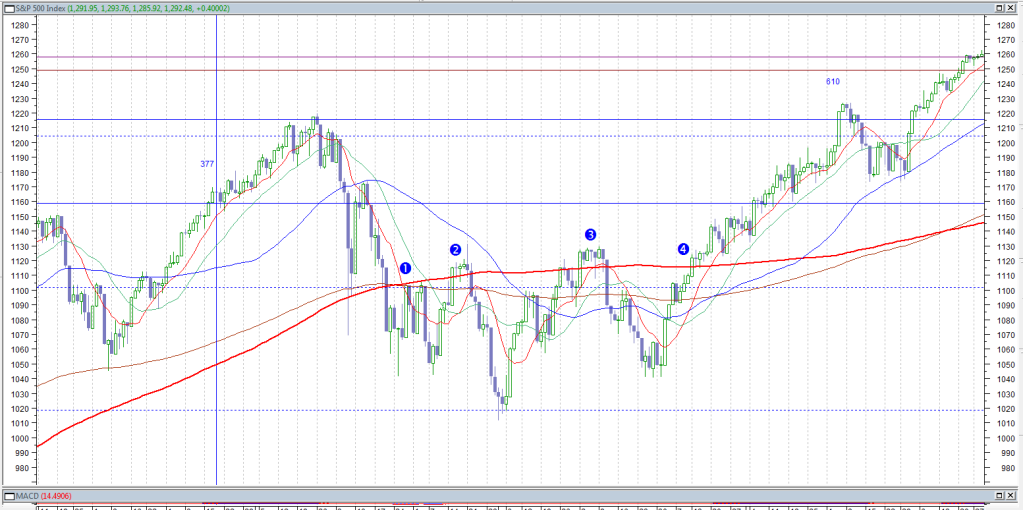
That analysis is heavy reading. It won't be for everyone and is focussed on pattern of trend and price (levels).
Looking back at how the index handled the 200 sma (think red line) last time it crossed below it takes us to the 2010 correction and you can see what happened after it managed to get past it on the 4th attempt. The current situation is that we have a daily swing low on 5 December above the 200 sma and we have now moved to a new high. Once that happened in 2010, the index didn't look back.
- Forums
- ASX - By Stock
- XJO
- xjo el capo's iced vovo thursday
xjo el capo's iced vovo thursday, page-63
-
- There are more pages in this discussion • 47 more messages in this thread...
This thread is closed.
You may not reply to this discussion at this time.
You’re viewing a single post only. To view the entire thread just sign in or Join Now (FREE)
Featured News
Add XJO (ASX) to my watchlist
 (20min delay) (20min delay)
|
|||||
|
Last
8,295.1 |
Change
68.800(0.84%) |
Mkt cap ! n/a | |||
| Open | High | Low |
| 8,226.3 | 8,319.4 | 8,226.3 |
Featured News
| XJO (ASX) Chart |
The Watchlist
EQN
EQUINOX RESOURCES LIMITED.
Zac Komur, MD & CEO
Zac Komur
MD & CEO
SPONSORED BY The Market Online


