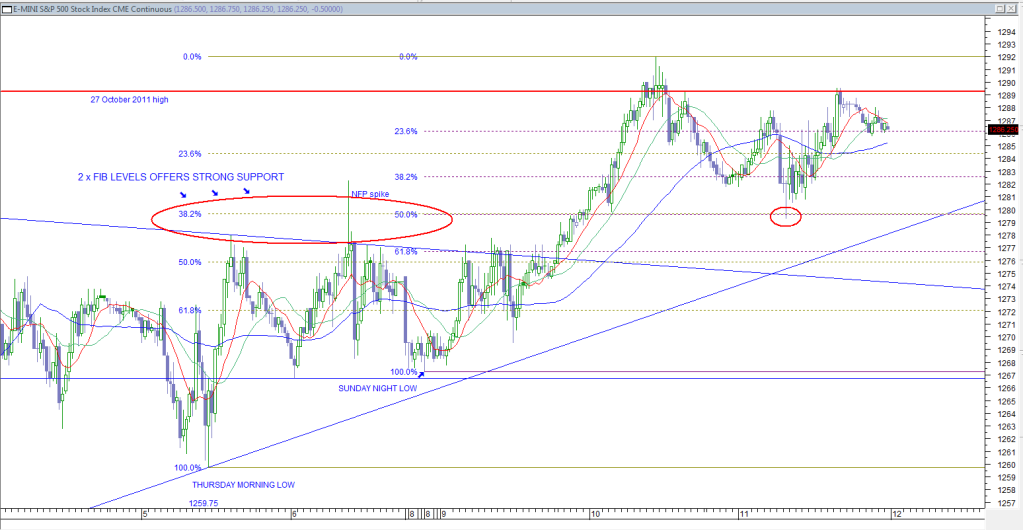
S&P futures 1 hr chart from the low to the consolidation after the gap up open on the first trading day of the year.
That low is marked as "Thursday morning's low" and there is a fib setting from that low to Tuesday's high. The second fib setting is from this weeks low (Sunday night NY time) to Tuesday's high. The pullback yesterday pre-open bounced strongly off the 2 fib levels marked and that is the low from Tuesday's high so far. Being at a 38.2% retrace of the move up from this year's low keeps the move up from that low in a strong position.
Upper resistance is the high from 27 October 2011 (thick red line) which is clear from the way price has move around it. Note how from this morning's high (the most recent high held down by the red line) the move down from that high is getting support from the 23.6% level of the smaller range. Support there suggest the move up is in a strong position. The buying that came in at that double fib level was strong buying. Can someone tell me why this will do anything less than consolidate for a further move up?
- Forums
- ASX - By Stock
- XJO
- xjo el capo's iced vovo thursday
xjo el capo's iced vovo thursday, page-65
-
- There are more pages in this discussion • 45 more messages in this thread...
This thread is closed.
You may not reply to this discussion at this time.
You’re viewing a single post only. To view the entire thread just sign in or Join Now (FREE)
Featured News
Add XJO (ASX) to my watchlist
 (20min delay) (20min delay)
|
|||||
|
Last
8,150.0 |
Change
-55.200(0.67%) |
Mkt cap ! n/a | |||
| Open | High | Low |
| 8,205.2 | 8,205.2 | 8,107.6 |
Featured News
| XJO (ASX) Chart |


