Twiggs on predicting recessions.Predicting recessions
By Colin Twiggs
September 20, 2019 9:30 p.m. EDT (11:30 a.m. AEST)First, please read the Disclaimer.
New format
Dear Friends,
I have been writing the Trading Diary newsletter for almost 20 years. It has been a great success but times are changing. Advertisers have largely migrated to Google & social media and independent advertising through brokers has slowed to a trickle. We have therefore decided to change the format of the newsletter in line with these developments.
In future, market analysis will be provided by way of subscription through The Patient Investor. The format will remain the same, with regular updates focused on major markets — stocks, precious metals, commodities, interest rates and the economy — and increased coverage of sectors and industries.
While the change may seem sudden, the changes in advertising revenue have been evident for more than a year and I have been postponing the inevitable for some time.
Details of subscriptions are available at The Patient Investor and include a $1 subscription for the first month.
Thank you for your support.
Predicting recessions with payroll and unemployment data
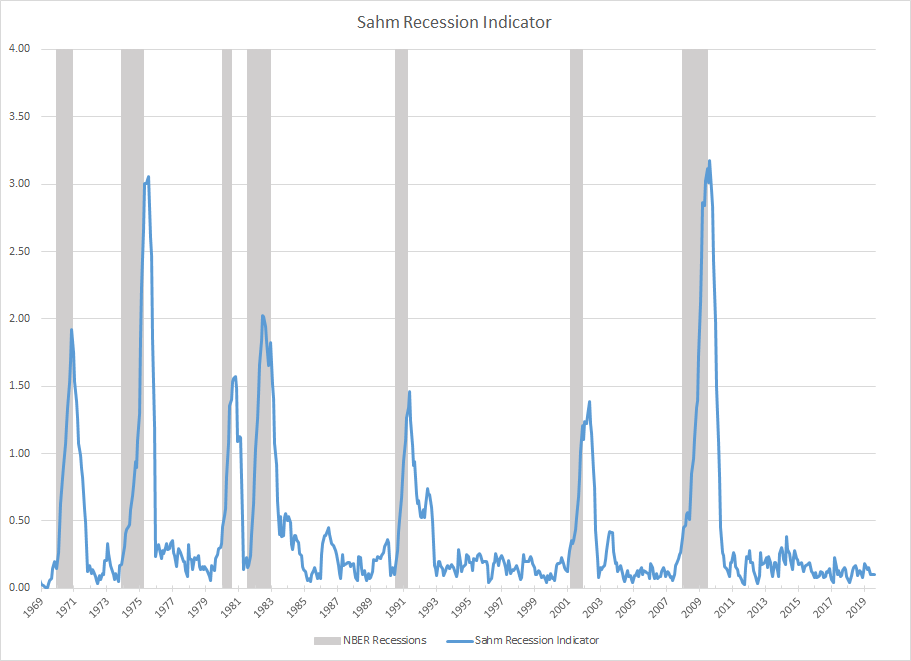
Recessions are notoriously difficult to measure (even the NBER occasionally gets it wrong) and an official declaration of a recession may be lagged by more than 6 months. Economist Claudia Sahm devised the Sahm Rule, using changes in unemployment levels, as a more timely predictor of recessions.
But the signal repeatedly lags the official start date of recessions by several months, limiting its usefulness for investment purposes.
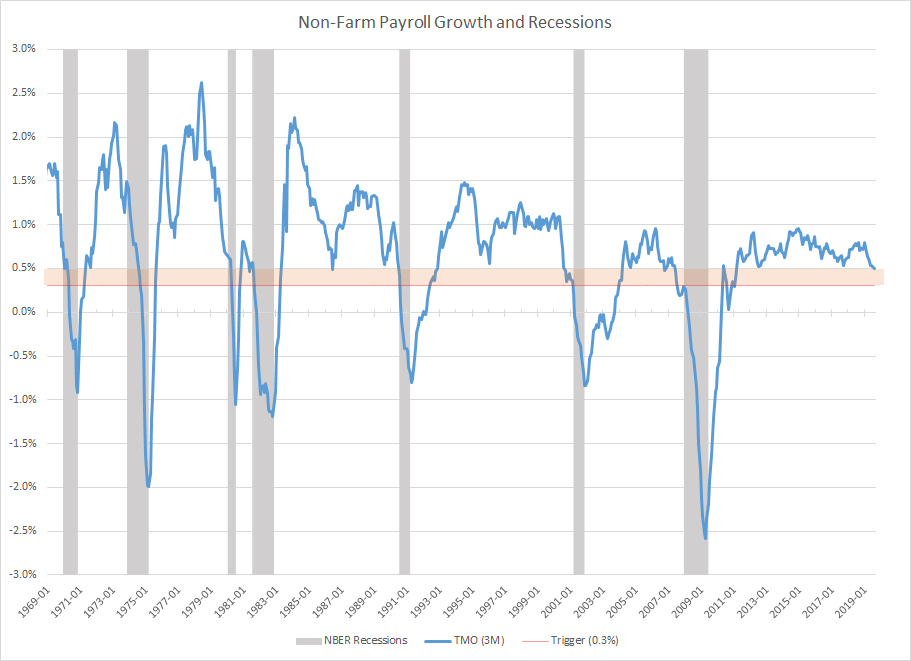
In previous articles I observed that payroll growth is a good predictor of recessions. But payroll growth has been declining for decades; so it has been difficult to devise a one-size-fits-all-recessions rule. Until I turned to using momentum.
Twiggs Momentum is my own variation on the standard momentum formula and I applied this to monthly payroll data to arrive at a 3-month TMO.
The orange band on the above chart reflects the amber warning range, between 0.5% and 0.3%, where recession is likely. If TMO crosses below the red line at 0.3%, risk of recession increases to very high.
When the TMO falls below 0.5%, a recession is likely, but there is one false reading at 0.49% in 1986. So I treat 0.5% as an amber warning level.
There are no false signals below 0.3% in the last 50 years. So I treat the 0.3% level as a red warning -- that recession risk is very high.
Some of the signals (e.g. 1975) are late but the TMO has a far better record, than the Sahm Rule, at giving timely warning of recessions.
The August 2019 TMO reading is an amber warning of 0.5%.
"I learned early that there is nothing new in Wall Street. There can't be because speculation is as old as the hills. Whatever happens in the stock market today has happened before and will happen again."
~ Jesse Livermore