ok, back from my lads' outstanding dinner
so from an ew perspective, i see this:
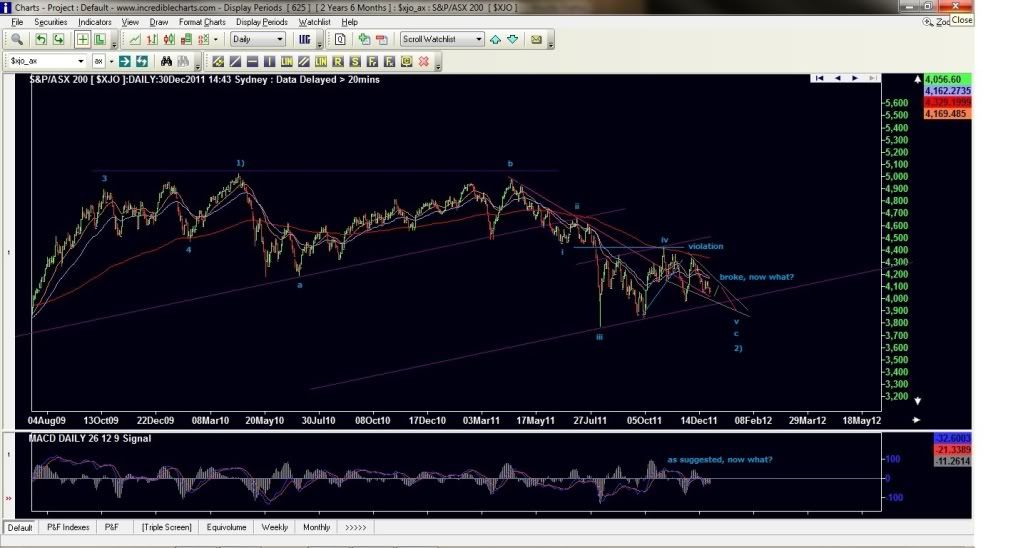
1) bullish case indicates the blue v at the hard right edge is, while apparently not happening, happening, albeit in a very odd way
(standby for the bearish case, where it may be happening, just not that clearly)
when i say 'in a very odd way' i provide that as a caveat of sorts because real trend changes are often disguised in the up and down action a market commonly takes when changing gears for the longer term
yes yes, i know there is much doubt about whether it is at all possible we can possibly defeat the business cycle, which bears down on us at many degrees
however, if i look at the usd and recall how many people hated it, how it was never going to go up, how we were being roasted alive (i get paid in usd), how the usa is stuffed etc etc then i do see a change in gears at the bottom
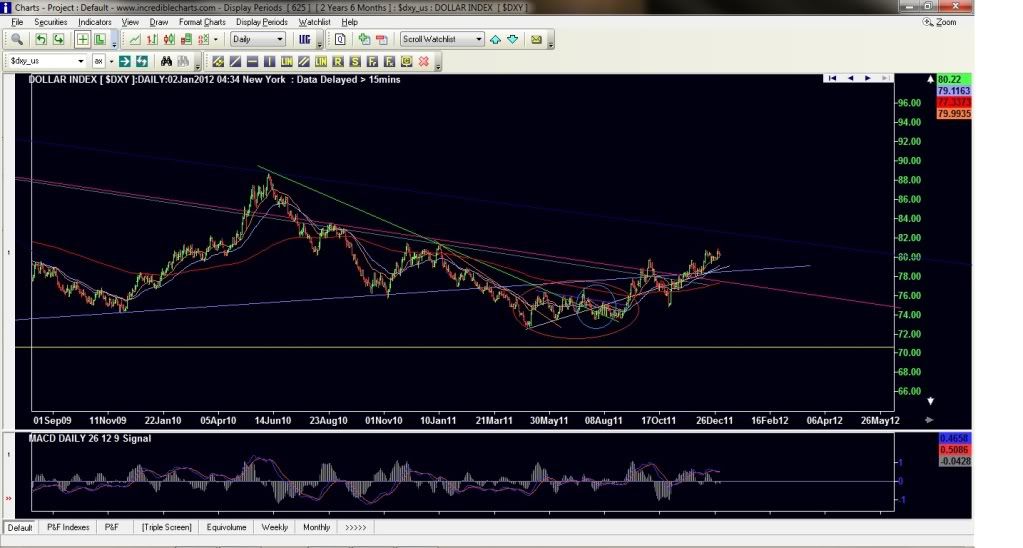
in fact, allow me to draw your attention to 8Aug11 in the dollar index, a point in time not unlike where we are right now by way of chart pattern in the xjo
see the similarity?
here it is
note the red circle and the blue circle within that red circle...this is of course the dollar index, which i'm only using as an example of changing gears, but it could be said the xjo post the august low is very similar in its tracking, a la "changing gears", and most particularly inside the blue circle of the dollar index versus my alleged blue wave v on our beloved xjo
so what, in ew terms, might i ascribe to our current situ on the big O
to wit, that we are perhaps seeing a fifth wave, which will be marked blue v, wherein the structure is overlapping and in five waves as an ending diagonal to mark an end to the blue c of probable 2)
here is an example
the ending diagonal has an abrupt move waiting in the wings a la the usd index
as i've said before, i'm not good at forecasting time or cycles so will leave that to others
form, however, may allow and even indicate a soon-to-be experienced rapid rise
the trick is to position oneself early
as with the low coming out of the GFC few of us were so positioned and, by the time the masses realised it was game on, the mad scramble to get long was already well underway
so good luck with it
now for the bearish case
2) would that this were so easy and we all make money on the long side, however shorting WDC 28Dec11 was done by those not so much in the know as those quick and ready to go with the intra-flow of the day, any day, while recognising the macd trend was and still is down
in wave form, that may translate into a blue v as a series of very ominous steps of one and two and one and two with the third waves about to play out to the downside in a very large way
this would quite probably negate my count altogether whereby i have suggested the GFC low was and will remain the low of low's for many years to come
yes, i get it gd0201, outstanding job again by the way, whereby we are in fact on the edge of the cliff circa similarities with 08/09, and that may be explained using the above
so enough of that
let's see where it heads
good luck
be nimble
- Forums
- ASX - By Stock
- XJO
- xjo new years party zoomba lounge
xjo new years party zoomba lounge, page-41
-
- There are more pages in this discussion • 31 more messages in this thread...
This thread is closed.
You may not reply to this discussion at this time.
You’re viewing a single post only. To view the entire thread just sign in or Join Now (FREE)
Featured News
NEWS
Antler Copper Project hits major permitting milestone – air quality permit advances to final review
Add XJO (ASX) to my watchlist
 (20min delay) (20min delay)
|
|||||
|
Last
8,150.0 |
Change
-55.200(0.67%) |
Mkt cap ! n/a | |||
| Open | High | Low |
| 8,205.2 | 8,205.2 | 8,107.6 |
Featured News
| XJO (ASX) Chart |


