After the 7 consecutive days down in late July early August there was one day up the three further days down, the last of which was an absolute monster 80 pointer on the s&p...
Having said that, I was scrolling through some old notes and McLaren put together a study of what happens after the first major leg down based on the Dow over the past 70 years and the view he formed in 2006 was that there is 6 to 9 months inside a trading range of the high and low formed.
Based on that, we would expect to trade between 1075 and thirteen something until at least February.
It will be interesting to see if that holds up.
Here is a chart of the emini s&p (2hr) dividing the move down into sections and the most recent rally attempt has put in the most points of the move down. That is indicative of the move down ending. Balance against that the fact the most recent high (marked 10) left the most number of points between it and the prior swing low of the move down (ignoring that little subdivision between 8 and 9). That is indicative that the move down is gaining further momentum. It would be helpful if it can break out of and then successfully back-test the channel line. Until that happens, I will be happy to take 3 or 4 points. I can't stay away! Caution imho.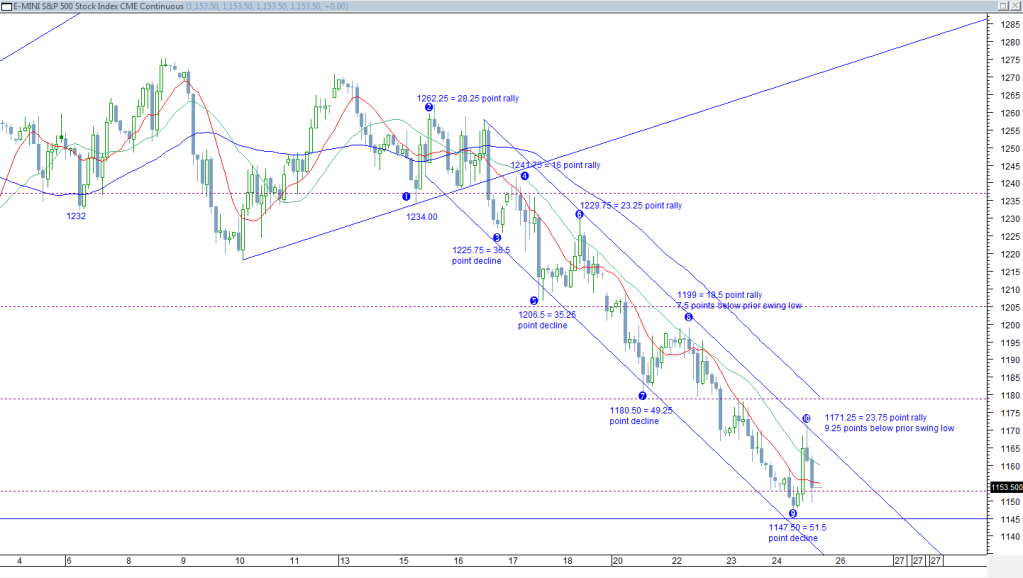
xjo weekend zoomba lounge, page-141


Add XJO (ASX) to my watchlist
 (20min delay) (20min delay)
|
|||||
|
Last
7,649.6 |
Change
-293.600(3.70%) |
Mkt cap ! n/a | |||
| Open | High | Low |
| 7,943.2 | 7,943.2 | 7,635.5 |
| XJO (ASX) Chart |