Hi all,
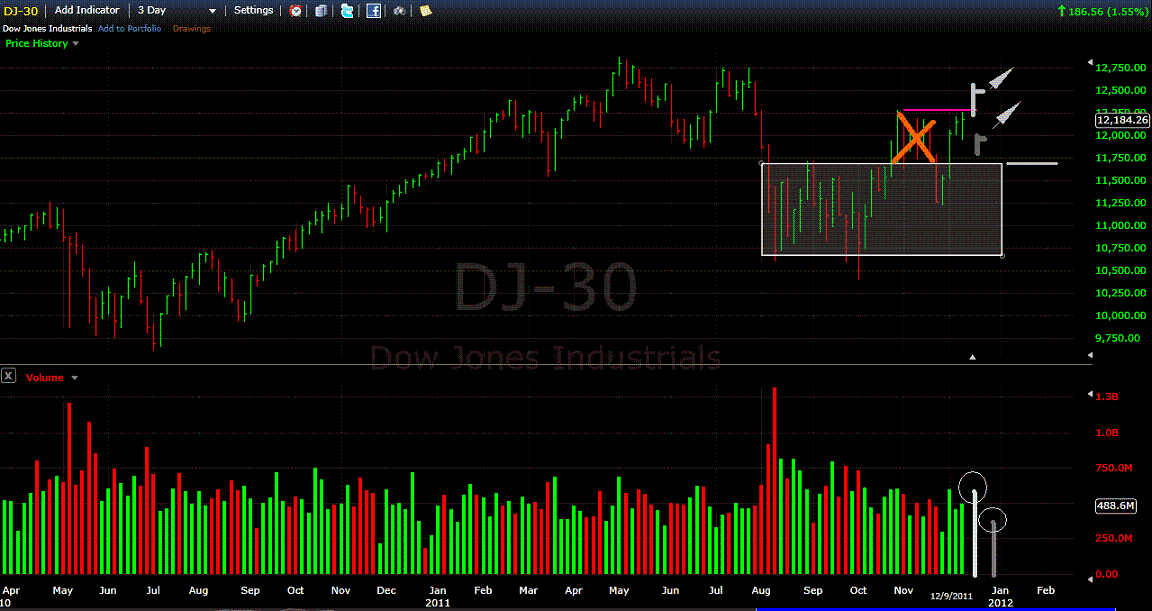
Have performed with much effort (brain strain) some analysis on the DJIA 3day, 2day, daily and even an intraday timefame.
The only one that is clear is the intraday and imo their Monday opening should be down, not to say it will close like that though.
On the larger timeframes I’d rather it breaks lower and gave us a clearer sign, say a backtest/test below its current level, above the TR high.
That imo would be the easier of the available options.
P.S. If you’ve got a busy day, there’s no reason to read the following, just skip to my conclusion below.
Daily – closed highish on the bar as on a tad less volume, much like a 2bar reversal.
Unfortunately though over the last week or so, the bars that it began with showed signs of weakness and
has now closed out with this flip/flap and back again action.
Just sitting prone but may bust higher as well.
2day bars – 4bars back we had a nice SOS thru the top of the range, but that was then followed by 2weaker bars.
Now with the last bar, well it’s standing back up high on a slight increase in volume after dipping down lower than the previous 2.
Normally that would be considered bearish, having an increase in volume on a downbar.
BUT cause of the high close and the increased spread, did it find buyers or is the increase from more supply.
3day chart, more below chart
3day bars – 3bars back we had that nice SOS, but it was followed by that weak bar.
The weakness in that bar we spotted or were following may have caused the present bar to break lower,
BUT it also has closed highish again on a slight increase in volume, maybe testing the top of that SOS.
Same thoughts as above, is the increase in volume a good (demand) or bad (finding supply) thing.
Conclusion = don’t’ know,
leaning a tad bullish ST, BUT it’s in a very prone region could go either way
- Forums
- ASX - By Stock
- XJO
- xjo weekend zoomba lounge
xjo weekend zoomba lounge, page-112
Featured News
Add XJO (ASX) to my watchlist
 (20min delay) (20min delay)
|
|||||
|
Last
8,300.2 |
Change
15.000(0.18%) |
Mkt cap ! n/a | |||
| Open | High | Low |
| 8,285.2 | 8,317.7 | 8,244.3 |
Featured News
| XJO (ASX) Chart |


