currency movements often lead the way, hence why i am posting these, to enable a sideways look at the art gallery of not life but stock markets
this is a sequence
i don't offer all the intervening charts as that will only clutter up the board and message
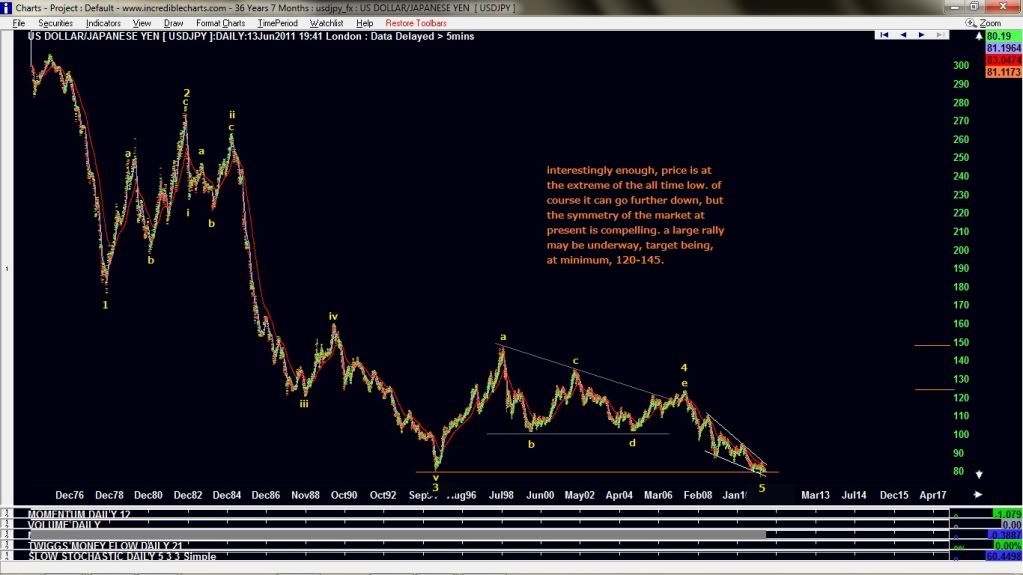
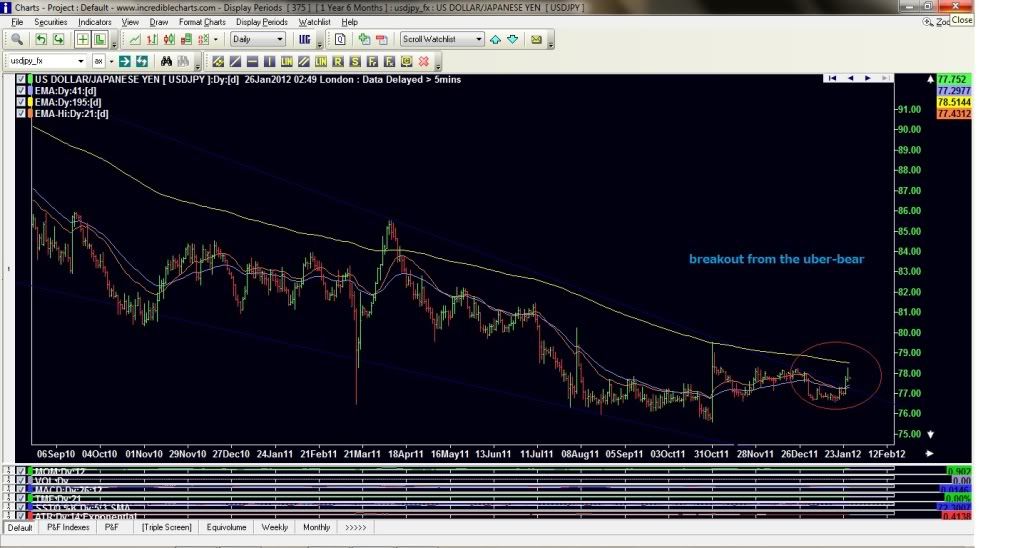
to wit, begin with the large picture first...
five down about to play out there, hope you can see it
all time lows being achieved
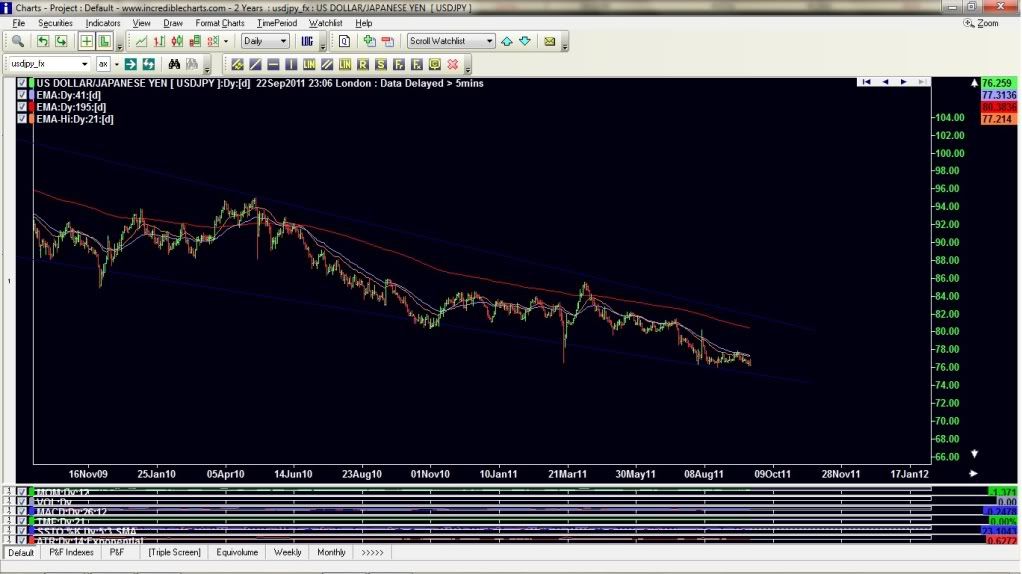
end of the world stuff, cue CNN story on japan being toast!
unmoved, a pillar of strength, never to be seen weakening
er, ok....
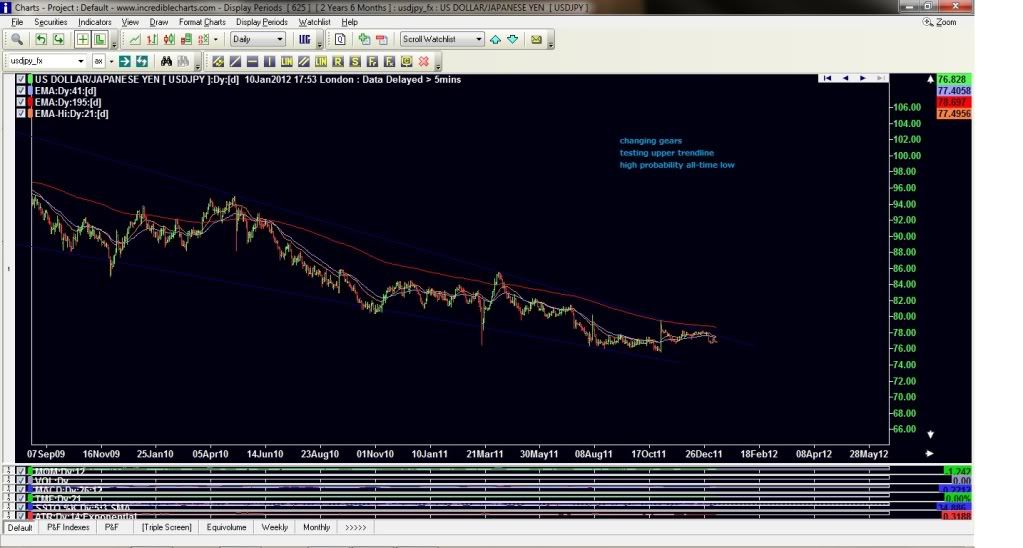
"can we not test the upper boundary of significant down trendline, mr market?"
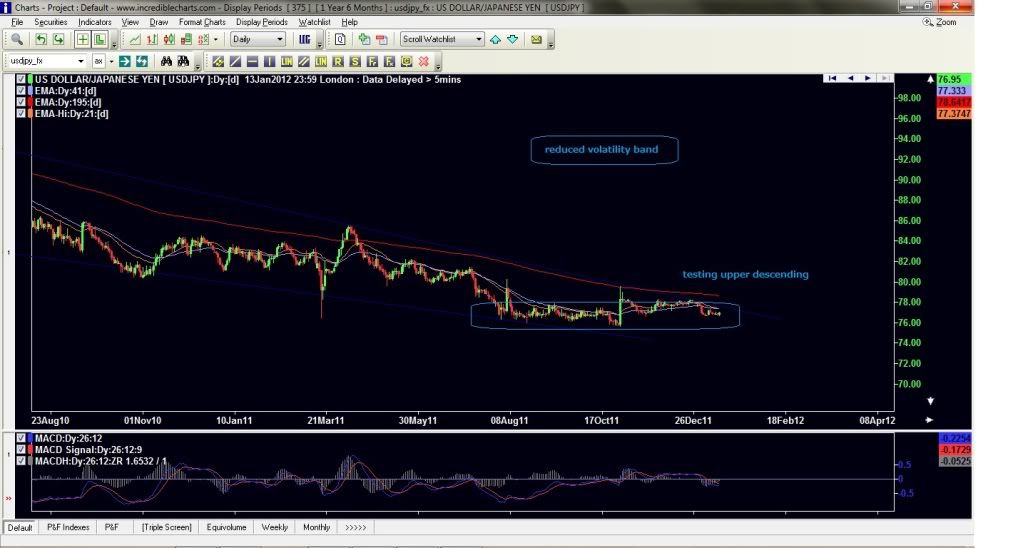
but the reports were many of reduced volatility, leading to traders shunning the usdyen cross, a once favored trading pair
and what did the market think of the reduced volatility?
it thought to break it, that's what
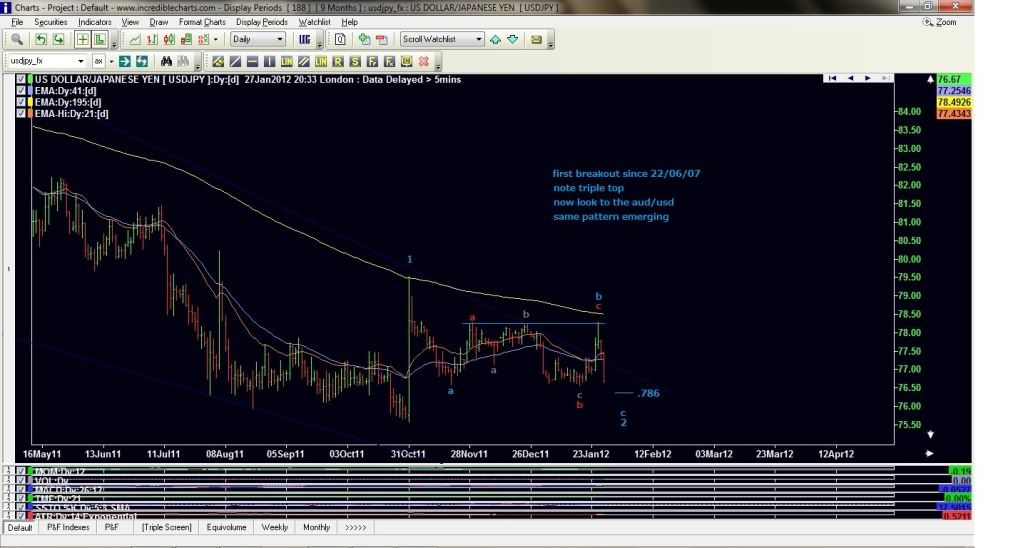
as the real deals know, the initial breakout isn't the real deal...the retest is, and here we have another .786
i should like you to have a close look at all the retracments in the XJO by the way, all of the retracements of the impulses post august 2011 that is
each one is a .786 of the impulsive move up, complex to be sure, but a repeating pattern of fibonacci nonetheless
why does the market do this?
why does it hum off the .786 wherein before it hummed off the .618 at all degrees of trend?
i would propose one probable reason as being the change in dynamics being just that, a change in dynamics
you could also suggest "mood" has changed, but a colleague of mine who trades currency - and i say that in the singular, not the plural, as he only ever trades the GBPUSD cross, suggested to me today the actual FACT, not fiction, of our across the board .786's suggests extraordinary returns are probable
i will leave that to you to figure out why, but it's a good thing to start with risk/reward in attemting an answer
ok, back to the charts....
where were we?
oh yes, the .786
and what happened after that?
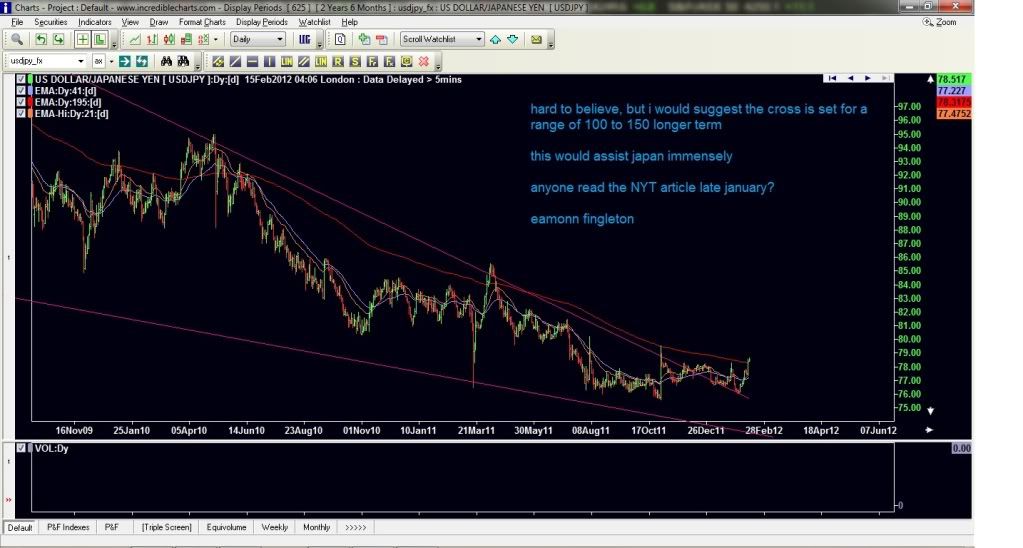
of course you can see the gap in late week trading gapping the market above the 200 day ema, effectively locking hopeful wannabe's out of the range for a time
so where to now?
well, that isn't really the point
the issue is what does it mean for australia!
like i suggested earlier, read the fine print
which, when using my viewfinder, is writ large
important post script: if you feel the usdyen cross is not relevant to the aussie situation, i cannot help you any further
- Forums
- ASX - By Stock
- XJO
- xjo weekend zoomba lounge
xjo weekend zoomba lounge, page-125
-
- There are more pages in this discussion • 14 more messages in this thread...
You’re viewing a single post only. To view the entire thread just sign in or Join Now (FREE)
Featured News
Add XJO (ASX) to my watchlist
 (20min delay) (20min delay)
|
|||||
|
Last
7,699.8 |
Change
19.200(0.25%) |
Mkt cap ! n/a | |||
| Open | High | Low |
| 7,680.6 | 7,738.2 | 7,643.3 |
Featured News
| XJO (ASX) Chart |
