i think perhaps i chose the wrong chart pattern yesterday. the USD bounced last night.....it looks to me like the USD has formed a rising wedge. Note the USD chart and how it's highs and lows are almost exactly the opposite to the market. the recent USD fall saw a rising market.
my observation is that the USD hugs closest to the turn dates of the armstrong cycle. Commodity and market charts are also effected but with some leading and lagging.
so a rise in the USD into the armstrong turn date would equate to a fall in markets. anecdotal reports are that the world is very worried about the USD. If the wedge breaks down come april 16th there may be a god almighty rally in commodities.......for a little while. It may then be very ugly up til june 10th 2011 when the armstrong cycle bottoms. the good news is then we would be back to where we were in late 2002. Another bull ??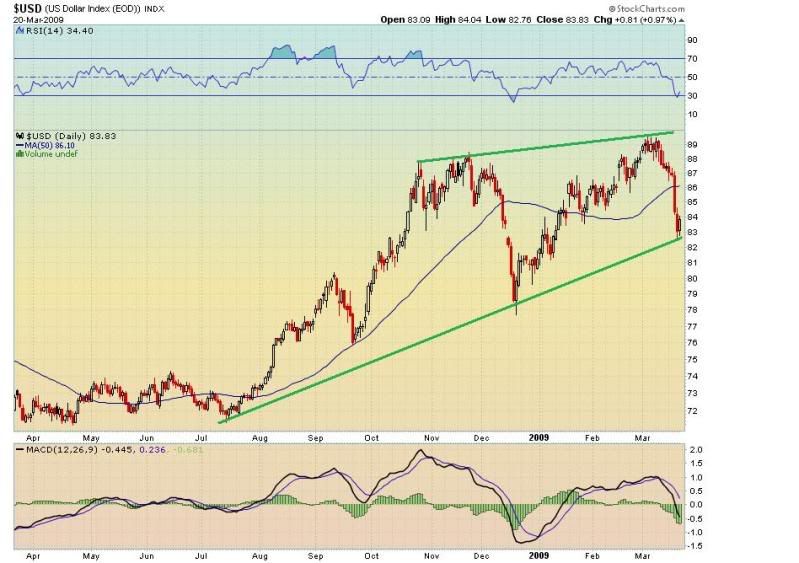


Add to My Watchlist
What is My Watchlist?
 (20min delay) (20min delay)
|
|||||
|
Last
8,757.2 |
Change
118.200(1.37%) |
Mkt cap ! n/a | |||
| Open | High | Low |
| 8,639.0 | 8,776.4 | 8,639.0 |
| XJO (ASX) Chart |