Thought I'd start a new chart thread, the other one was getting pretty big.
The chart below (1 month / 30min) shows cumulative volumes at different price levels during the recent run up, buying climax and subsequent gap filling. The colours go from black (high volume), through red, yellow, green and finally blue (low volume).
As you can see there is significant volume around the $1.32 / $1.35 mark and a reasonable blanket of volume down to $1.25. Now I'm hoping this level will provide some reasonable support in terms of volume, with the view that many traders who sold out during the run up from ~$1.25 up to and especially the $1.32 and $1.35 levels and then watched the SP go to $1.62 will be looking to jump back in - human nature IMO :)
Also, my understanding in terms of gaps and why they fill has two parts:
1) In this instance with a big gap up, obviously no-one sold out in the gap, so there's no-one in the gap price range regretting their decision and looking to buy back in the gap range.
2) Clearly lots of buying occurred above the gap by the exuberant herd (and lots of selling by the smart money), which means many bulls are trapped above the gap.
Taking the above into consideration, not too many bulls in the gap range to battle the bears, so the gap fills.
Will obviously be looking for testing on the daily to jump in. Maybe we'll see an accumulation phase at this level and hoping the shorters aren't eyeing off the low volume zone from $1.25 to $1.07 left behind in the rapid run-up.
You can also see that the $1.40 level prior to the big gap up didn't provide a lot of support in terms of volume, and I suspect it got hung around this level on the way down purely because it was previously the highest high since the 21st September.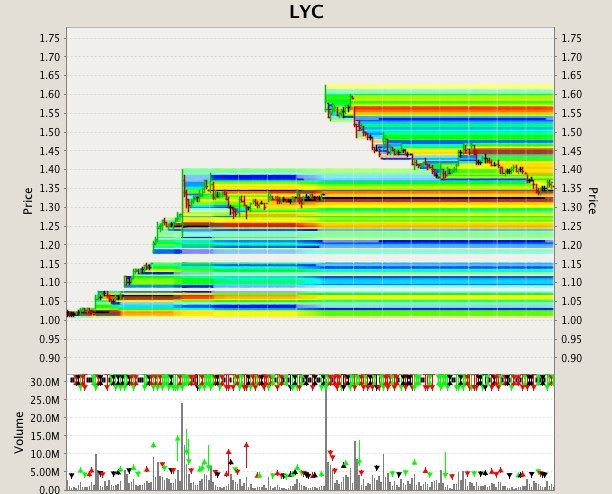
yippee gap filled


Add LYC (ASX) to my watchlist
 (20min delay) (20min delay)
|
|||||
|
Last
$7.75 |
Change
0.000(0.00%) |
Mkt cap ! $7.244B | |||
| Open | High | Low | Value | Volume |
| $7.81 | $7.88 | $7.66 | $13.33M | 1.713M |
Buyers (Bids)
| No. | Vol. | Price($) |
|---|---|---|
| 4 | 17351 | $7.74 |
Sellers (Offers)
| Price($) | Vol. | No. |
|---|---|---|
| $7.75 | 85285 | 1 |
View Market Depth
| Last trade - 16.10pm 14/10/2024 (20 minute delay) ? |
| LYC (ASX) Chart |