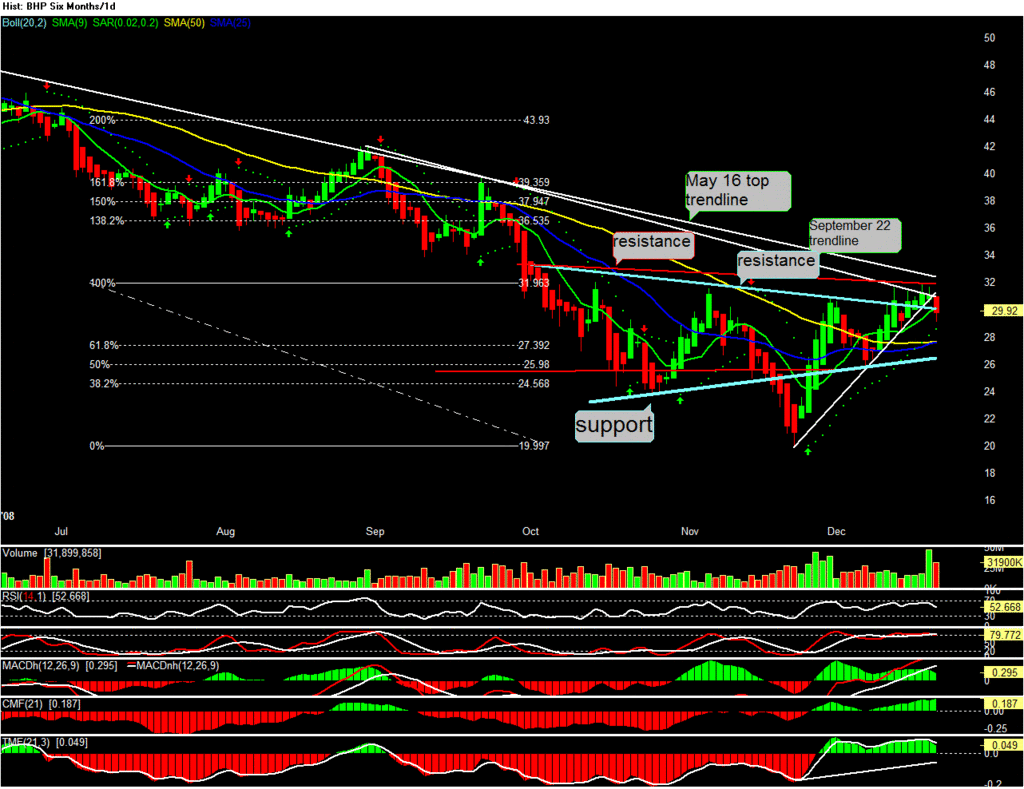
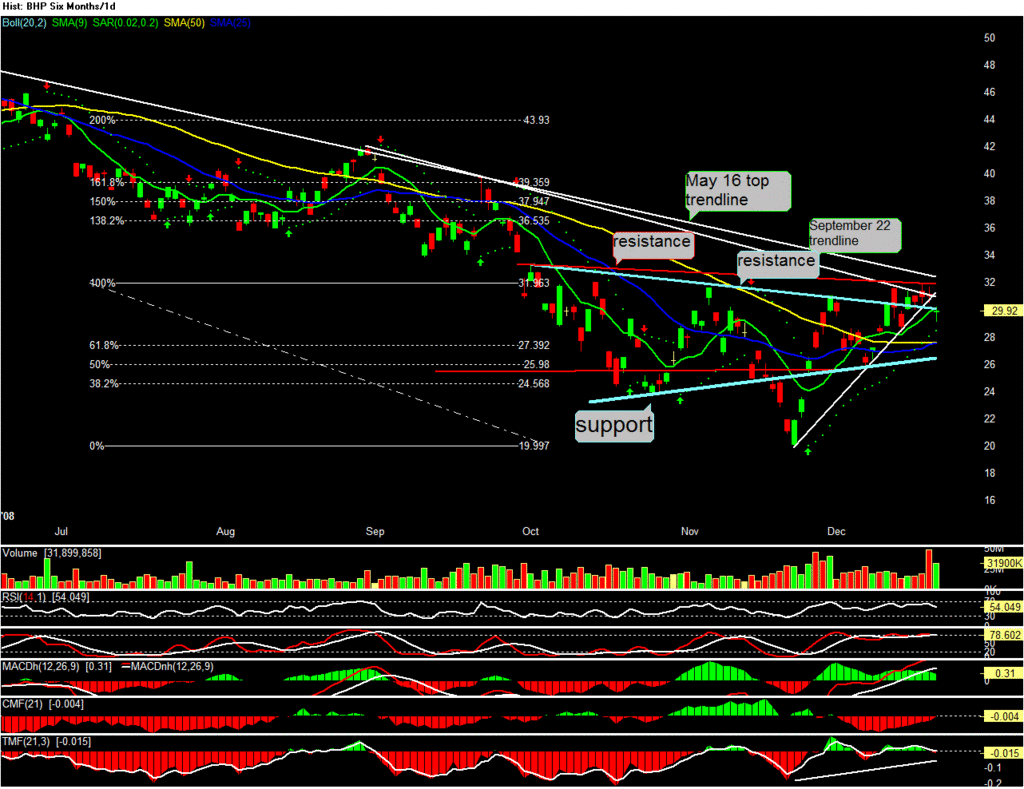
Is it breaking down and out of its wedges and triangles?
The first chart is a normal daily, and the second uses the Heikin-ashi candles which omit gaps and are calculated differently...but show possible trend changes more graphically.
(Day's low by the way was on a minor Fib level)
- Forums
- ASX - By Stock
- you just cant keep the big guy dow
Is it breaking down and out of its wedges and triangles? The...
-
-
- There are more pages in this discussion • 18 more messages in this thread...
You’re viewing a single post only. To view the entire thread just sign in or Join Now (FREE)
Featured News
Add BHP (ASX) to my watchlist
 (20min delay) (20min delay)
|
|||||
|
Last
$44.58 |
Change
-0.790(1.74%) |
Mkt cap ! $226.1B | |||
| Open | High | Low | Value | Volume |
| $44.51 | $44.65 | $43.97 | $414.4M | 9.353M |
Buyers (Bids)
| No. | Vol. | Price($) |
|---|---|---|
| 1 | 12 | $44.56 |
Sellers (Offers)
| Price($) | Vol. | No. |
|---|---|---|
| $44.58 | 8261 | 1 |
View Market Depth
| No. | Vol. | Price($) |
|---|---|---|
| 1 | 12 | 44.560 |
| 1 | 4293 | 44.550 |
| 1 | 58 | 44.480 |
| 2 | 21 | 44.450 |
| 1 | 224 | 44.440 |
| Price($) | Vol. | No. |
|---|---|---|
| 44.580 | 8261 | 1 |
| 44.590 | 100 | 1 |
| 44.600 | 2000 | 1 |
| 44.620 | 3336 | 3 |
| 44.630 | 3084 | 3 |
| Last trade - 16.10pm 04/10/2024 (20 minute delay) ? |
Featured News
| BHP (ASX) Chart |


