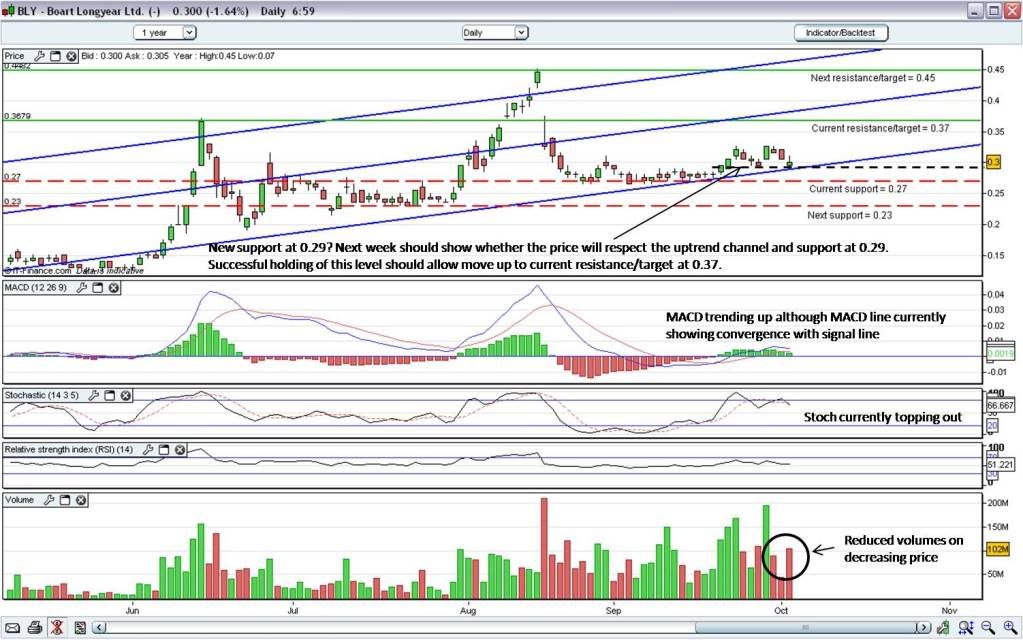
Hi All, just thought I'd post the current daily chart position on BLY (see below). Despite the late week market sell-off, BLY has held up well, managing to stay around the 0.30 into Friday's close. The current price remains above the current support at 0.27, and is still respecting the current uptrend channel indicated.
Next week will be an interesting test to see if BLY can maintain 0.295 and above, or re-test 0.27. If both hold (depending on current market pressure), then we should see BLY move up to test the current resistance level at 0.37. If current support holds this would confirm market support for BLY now that its paid down its debt, and imo would put a pretty solid floor under the SP moving forward.
The upward move to 0.325 early in the week showed that the current retail SPP is not holding the price back, so a move to 0.37 is entirely possible imo.
The MACD an Stoch are both showing toppiness as a result of the recent move, while the RSI is continuing to show a very gradual uptrend. Volumes reduced significantly late in the week compared to the volumes during the upward move to 0.325 - a sign of support for the existing price level?
Anyway, looking good for me. Good luck to all holders. Cheers, Sharks.
- Forums
- ASX - By Stock
- BLY
- bly chart
bly chart
-
- There are more pages in this discussion • 3 more messages in this thread...
You’re viewing a single post only. To view the entire thread just sign in or Join Now (FREE)
Featured News
Add BLY (ASX) to my watchlist
Currently unlisted public company.
The Watchlist
CCO
THE CALMER CO INTERNATIONAL LIMITED
Anthony Noble, CEO
Anthony Noble
CEO
SPONSORED BY The Market Online


