2022.07.20
Capital inputs account for about half the total costs of mine production — the average for the economy as a whole is 21%.
Mining is an extremely capital-intensive business for two reasons. First, mining has a large up-front layout of construction capital called capex – the costs associated with the development and construction of open-pit and underground mines. There is often other company-built infrastructure like roads, railways, bridges, power-generating stations and seaports to facilitate extraction and shipping of ore and concentrate. Second, there is a continuously rising opex, or operational expenditures. These are the day-to-day costs of operation: rubber tires, wages, fuel, camp costs for employees, etc.
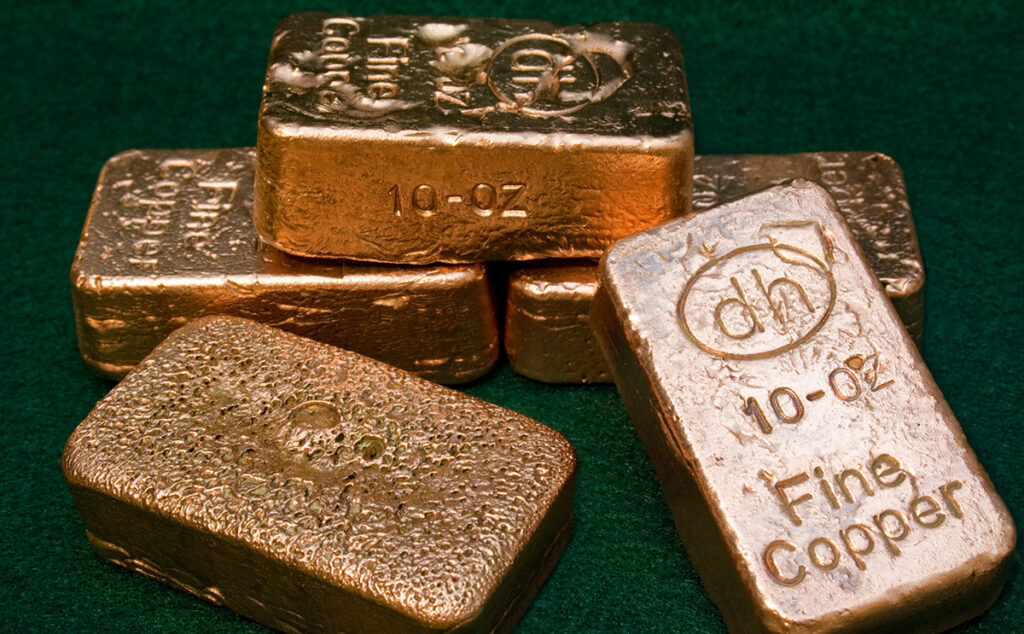
Copper mining has become an especially capital-intensive industry – the average capital intensity for a new copper mine in 2000 was between US$4,000-5,000 to build the capacity to produce a tonne of copper, in 2012 capital intensity was $10,000/t, on average, for new projects. Today, building a new copper mine can cost up to $44,000 per tonne of production, an AOTH analysis has found.
Capex costs are escalating because:
- Declining copper ore grades means a much larger relative scale of required mining and milling operations
- A growing proportion of mining projects are in remote areas of developing economies where there’s little to no existing infrastructure.
- Many inputs necessary for mine-building are getting more expensive, as cross-the-board inflation, the highest in 40 years, infiltrates the industry. This includes two of the largest costs, wages and diesel fuel, used to run mining equipment.
The bottom line? It is becoming increasingly costly to bring new copper mines online and run them.
Capital intensityThe initial capital expense (capex) of building a mine is high. All the low-hanging fruit has been mined. Companies have to go further afield to find deposits. The deposits now being mined are getting older; the metallurgy is more complex and grades are going down. In 2000 it cost $4,000-5,000 on average to build the infrastructure to produce a tonne of copper. Now that number is north of $12,000/tonne.
Some examples:
- Cobre Panama: Inmet’s Cobre Panama project capex climbed to US$6.2 billion in 2012 from US$4.8 billion, a capital intensity higher than $15,000/t. When the mine opened in 2019, the capex had ballooned to $6.7 billion, with a production guidance of 140,000 to 175,000t copper, leaving a capital intensity of $38,285/t. ($6.7B/175,000t)
- Quellaveco. Construction of Anglo American’s copper project in Peru started in 2018, with the four-year development culminating in its commissioning earlier this month. At full capacity, Quellaveco expects to deliver 300,000 tonnes of copper annually. The $5.5B capex divided by 300,000t amounts to a capital intensity of $18,333. Again, this is how much the mine cost to build, measured in capex cost per tonne of production.
- Julong. The world’s largest porphyry copper mine in China started production in December, 2021. Owner Zijin Mining expects to produce 120-130,000 tonnes of copper this year after a first phase is completed. Total capex of around $1.7 billion leaves a capex cost per tonne of production at $13,769 ($1.79B/130,000t)
- Oyu Tolgoi. The huge copper-gold mine in Mongolia, owned jointly by Rio Tinto, Turquoise Hill Resources and the Mongolian government, was put into production in 2013 with an initial capex of $6 billion. A transition from open-pit to underground operations is ongoing, however costs have risen considerably. Rio Tinto, the world’s second largest miner, now pegs the total project cost estimate at $7.06 billion, $1.8B higher than its original estimate in 2015. Once completed, the underground section will hike production from 125-150,000 tonnes to 560,000t at peak output, expected by 2025 at the earliest, leaving a capex cost per tonne of production of $12,500 ($7B/560,000t)
(One large mine to buck this trend is Ivanhoe Mines’ Kamoa-Kakua copper mine which started commercial production last year. The world’s highest-grade major copper mine is expected to produce 200,000 tonnes of copper per year in the first phase, doubled to 400,000 tpa after Phase 2. Kamoa’s production measured against a relatively low capex for its size, $1.3 billion, gives it a capital intensity of just $6,500/t ($1.3B/200,000t)
It’s interesting to assess the capex cost of production for two copper mines that opened in British Columbia in recent years — the Copper Mountain mine near Princeton, and the Red Chris mine in northwestern BC’s “Golden Triangle”. Because these mines are smaller and cannot benefit from economies of scale, such as Kamoa, Cobre Panama and Oyu Tolgoi,their capex costs per tonne are quite high.
Opened in 2011, Copper Mountain was designed to produce 49 million kilograms (108 million pounds) of copper, 850,485 grams (30,000 ounces) of gold and almost one million grams (350,000 ounces) of silver annually. In its first year of production, the $441 million mine produced 10,024 tonnes of copper, leaving an “off the charts” capital intensity of $43,994 per tonne.
Imperial Metals’ Red Chris mine started in 2015 and in its first year produced nearly 40,000 tonnes of copper. At a capex of $669 million, Red Chris’ capex cost per tonne of production was $16,725.
(We see the same higher-cost scenario with nickel, except a few degrees worse. Capital intensity for new nickel mining has gone through the roof. The discrepancy between the initial per-pound capital cost of nickel projects and the ultimate construction cost is over 50%. Larger-scale projects have not demonstrated lower per-unit capital costs. Sometimes large projects have even higher capital intensity.
Global nickel supply is increasingly coming from laterite nickel deposits, which require high-pressure acid leach (HPAL) plants. We are now looking at north of $35 per pound capital intensity as we move into these multibillion-dollar ferronickel and HPAL projects. Several are in Indonesia, which aims to become a global hub for battery metals mining, processing and electric-vehicle assembly, thanks to billions worth of investment from China)
Last fall Fitch Solutions put out a report primarily of interest for what it said about Chile. While the country has attracted substantial mining investment in recent years, including from leading copper producers like BHP and Teck, in the longer term, Chile’s declining ore grades present a key downside risk to production forecasts. The chart below shows Chile’s average copper grades more than cut in half between 1999 and 2016, from 1.41% Cu to 0.65% Cu.Source: Cochilco
As ore grades decline, higher amounts of ore need to be processed, to yield an equivalent amount of copper.
Chile is also producing less copper. According to Cochilco, the country’s state copper commission, in 2000 Chile produced 34.7% of the world’s copper; by 2017, the percentage had fallen to 26.7% (the USGS’s latest figures show Chilean mine production at 26% of the global total)
Making matters worse, after more than a decade of drought, freshwater supplies are becoming a big problem in Chile. Copper mines there require lots of water to process sulfide ores, and the lower the grade, the more water must be used.
Since major copper miners are increasingly turning to low-grade sulfide deposits to beef up their production, their water consumption is expected to jump up to 20.9 cubic meters per second (about half an average home pool). Water scarcity hinders their ability to produce, and drives mining costs per tonne higher.
The country’s left-ward shift is another mark against the top copper producer as far as attracting mining investment. Chile’s environmental commission of the Constitutional Convention has just approved a rule for inclusion in the new Constitution that would nationalize “strategic assets” including lithium, copper and precious metals. The rule states, “there will be no place for any compensation for the rights over mining and hydrocarbon assets, since by Constitutional mandate they belong to the State of Chile.”
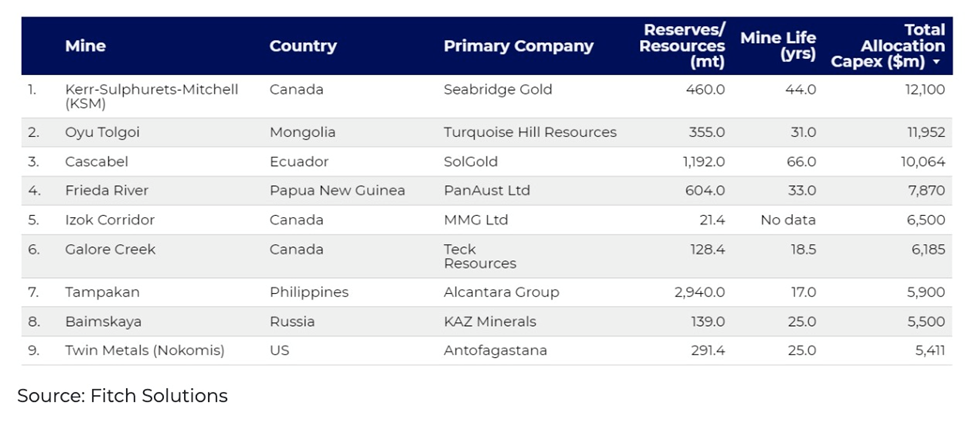
It is therefore no surprise that none of the projects on Fitch’s top 10 copper projects by capex are in Chile. For the others, capital intensity continues to rise. In first place is Seabridge Gold’s KSM project in British Columbia, with an eye-watering capex of $12.1 billion. Second is the above-mentioned expansion at Oyu Tolgoi, anticipated to cost $11.2B total including $7B of underground development; SolGold and Cornerstone Resources’ jointly-held Cascabel project in Ecuador places third with a capex allocation of just over $10 billion; followed by the Freida River project in Papua New Guinea ($7.8B), MMG’s Izok Corridor in Canada’s Bathurst Inlet ($6.5B), Teck’s Galore Creek in British Columbia ($6.1B) Alcantara Group’s Tampakan project in the Philippines ($5.9B), Kaz Minerals’ Baimskya project in Russia ($5.5B), and Antofagasta’s Twin Metals project in Minnesota. (the latter project looks unlikely to proceed, following the US government’s decision earlier this year to cancel leases held for the group’s proposed copper and nickel mine near Minnesota’s Boundary Water region).It’s worth asking how high the copper price needs to go to make these projects viable. Recall that when copper mines were being commissioned a decade ago, the capital intensity for new copper projects was about $10,000/t. The average monthly copper price per tonne topped out in 2011 at $8,828/t. In other words, despite a record-high copper price that year, the capex cost to mine a tonne of copper exceeded the price received. Prices declined after 2011 to $4,868 monthly average price per tonne in 2016 before partially recovering in 2018 to $6,530. Prices dipped in 2020 with the onset of the pandemic, but quickly recovered. From Statista, we learn that in 2021, the average price of copper was $9,322/t. Copper’s new record-high, set in May 2021, was $10,512, a 130% increase over March, 2020.
However, the cost to build a new mine, outlined in the several examples above, is in most cases higher even than copper’s best-ever price of $10,512/t, or $4.76/lb, and certainly a lot more than copper’s current (July 19) price of $7,162 per tonne ($3.24/lb).Source: *****
Costs per tonne rising
As mentioned at the top, copper mining is not only getting more expensive due to rising capital costs, such as building new roads, railways, bridges, power-generating stations and processing facilities, but increasing day to day expenditures, known in industry parlance as “opex”.
In a March 2022 report, Bank of America said the costs of a number of key inputs have risen dramatically from their 2020 pandemic lows. They include a 350% increase in the cost of fuel, a more than 600% rise in sulfuric acid in Chile, a 300% increase in steel and a 400% increase in spot LNG in Europe.
Again it’s worth looking at Chile, the world’s biggest copper producer, to get an idea of where costs are at, and likely heading.
In the graph below from Cochilco, note that in 2000, copper could be mined in Chile for US$68 per pound; by 2017 costs had more than tripled to $211.80/lb.Source: Cochilco and Wood Mackenzie, Q3 2017
Among the cost items that went up between 2000 and 2016, the most significant was labor, an increase of 35.1%, other consumables @ +24.3%, services & contractors (+20.2%), power (+9.9%), sulfuric acid (+5%) and diesel @ +4%.Source: Cochilco
According to Cochilco, via BN Americas, Chile’s copper output fell 1.9% to 5.63Mt in 2021 due to higher operational costs and lower grades.
Of 22 large copper mining operations in the Cochilco study, 16 posted an increase in cash costs. The average for all 22 mines @ US$132.80 per pound last year, an increase of 10 cents/lb over 2020. The main factors were higher prices for energy, fuel, freight and sulfuric acid.
Bloomberg reports that mining companies are likely to see a drop in profits following record earnings, amid mounting cost pressures and slowing Chinese growth. A February article cited the world’s top two miners, BHP and Rio Tinto, saying that a lack of workers in key roles is having an impact on their operations. Australia-focused Fortescue Metals reported in January that its costs had risen 20% over the past 12 months driven primarily by rising fuel prices and labor shortages.
Conventional vs oxide/ chalcocite processingAnother variable that must be considered when evaluating copper opex, is the type of ore being produced. Mines that produce electro-refined copper via conventional mining/ concentration/ smelting/ refining will pay a much higher cost per pound (or kilogram) than electrowinning copper cathodes from oxide and chalcocite ores. The former has costs ranging from $1-2 per kilogram, compared to $3-6 per kg for the latter. Moreover, copper extraction is said to be profitable when the selling price of copper is above $6 per kg ($6,000/tonne) and unprofitable when the price falls below $3,000/tonne. At a current price of $7,162 per tonne (3.24/lb or $7.16/kg), copper miners should all be booking profits. According to Fast Markets, Mining companies traditionally refer to a $3-per-lb copper ($6,614 per tonne) price as a floor to spur new investment.
Supply lagging demandWith copper prices well into the profitability range, one would think that the market would be flooded with new supply, as even the most marginal producers jump in with new tonnage, to capitalize on high prices. As the 5-year chart below shows, even though spot copper has skidded from peaks in May and October, 2021 of ~$4.70/lb, the current $3.25/lb is still the highest copper has been since November 2020.
Source: *****
S&P Global Market Intelligence predicts that due to a shortage of projects, supply will lag demand in the long term.
While the New York-based analytics firm expects mined copper production to rise to 26.14Mt in 2025, from 21.16 Mt in 2020, that will not prevent a supply gap in the post-2025 years.
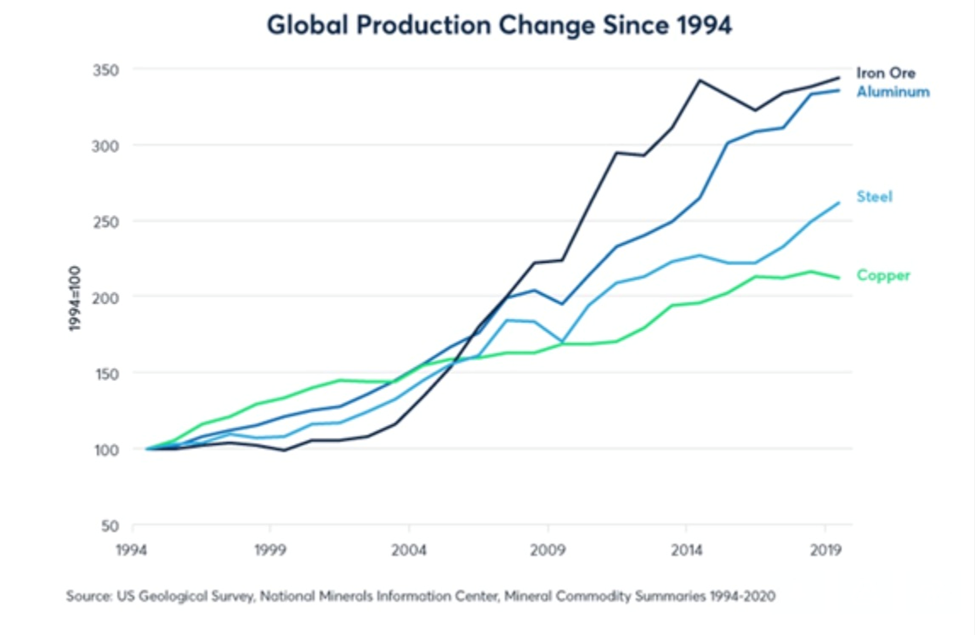
That’s because, as demand for copper in manufactured goods and housing has surged, supply has not kept up.According to CME Group, there has been a much lower growth in copper supply over the past 25 years compared to say, aluminum and iron ore:
Since 1994, copper mining supply has doubled while the supplies of other metals have tripled.Mined copper supply has grown more slowly than other metals over the past quarter-century.
As previously reported, global mined copper production will drop from the current 20Mt to below 12Mt by 2034, resulting in a supply shortfall of 15Mt. By then, over 200 copper mines are expected to run out of ore, with not enough new mines in the pipeline to take their place.
Graph courtesy of Hamish Sampson / Analyst at CRU’s Copper Team
Production from existing copper mines, including concentrate and solvent extraction-electrowinning, is expected to increase at a CAGR of 1.0% in 2021-25 but fall at a CAGR of 4.7% in 2026-30, driven by declining ore grades and mine closures.
These mines include Glencore’s 33.75%-owned Antamina (BHP 33.75%, Teck Resources 22.5%, Mitsubishi 10%), Codelco‘s Radomiro Tomic and Teck’s Highland Valley.
As a result, production from existing operating mines — not considering those assets that are starting up, project expansions or mine restarts — is projected to fall to 15.90Mt in 2030 from 20.53Mt in 2021.Expected copper deficit in 2030. Source: S&P Global Market Intelligence
Diminished supply from operating mines, combined with the projected increase in demand for copper over 2021-2030, could result in a 3.85Mt production shortfall in 2025, according to S&P Global estimates.
The refined copper market will also move into a 279,000-tonne deficit by 2025, from a 142,000-tonne surplus in 2020, S&P Global adds.
From 2026 to 2030, the copper industry will be unable to meet a growing demand for concentrate, even when including uncommitted development-stage projects that could potentially move forward and start up during this period, S&P Global says.Global copper output 2025-30. Source: S&P Global Market Intelligence
Dwindling copper reserves and lower ore grades at some of the world’s largest mines also mean that new deposits would only be replacing existing output, thus not contributing to supply growth.
The solution, as simple as it sounds, is to have more copper projects that can be developed into producing mines. S&P Global has identified 14 probable and 26 possible projects in the copper pipeline, though the firm admits it’s unlikely that all will come to fruition.
Therefore, given copper‘s increasing demand from the EV and renewable energy sectors, more action from the mining industry is imperative to close the supply gap.
S&P Global estimates that new copper discoveries have fallen by 80% since 2010.
As of now, the global copper cupboard is quite bare. To even have a chance at net-zero emissions, at least 19Mt of additional metal must be delivered by 2040, the equivalent of one new Escondida mine (1Mt annual production) every year.
A major rise in copper demand from new “blacktop” infrastructure (think roads, bridges, airports, etc.), combined with high demand for copper from large-scale efforts on behalf of governments to decarbonize and electrify, is not being met with an adequate supply of the industrial metal. Trillions worth of new projects are thus in danger of falling by the wayside unless much more copper is discovered — more than is currently possible, in my opinion.
A recent report from S&P Global predicts the world’s appetite for copper will reach 53 million tonnes, on an annual basis, by mid-century. This is more than double current global mine production of 21Mt, according to the US Geological Survey.
How are we going to find the copper?
As capex and opex for new copper mines and expansion projects continue to rise, the gap between expectations of new copper supply and reality is likely to keep growing. This week we had two more events take place that are likely to worsen the copper supply-demand balance. The first was another move forward in the Chilean government’s quest to nationalize the mining industry. If this happens, and it looks like it will, I have no doubt that we will see a mass exodus of minerals investment from Chile, and likely Peru, the next domino to fall.
The second event was a decision in Congo to suspend metal exports from Tenke Fungurume, a large copper-cobalt mine owned by China’s CMOC.
The demand to halt exports came from a court-appointed administrator, who was appointed in February to run the mine for six months, in response to a lawsuit by Congolese miner Gecamines, which holds a minority stake in Tenke Fungurume. Gecamines alleges that CMOC understated the mine’s reserves to reduce royalties it pays to Gecamines. CMOC denies the allegation. The administrator demanded that CMOC suspend export of its production because CMOC and Gecamines had not reached agreement on how to sell the mine’s output. (Reuters).
Congo is the world’s top producer of cobalt and Africa’s leading copper-mining country. Tenke Fugurume accounted for more than 10% of global cobalt output in 2021.
ConclusionThe copper market is tight based on a combination of factors including lower ore grades, droughts/ lack of fresh water, resource nationalism in top producers Chile and Peru, and a dearth of new discoveries in recent years. To avoid a copper shortage as early as 2025, billions will need to be spent on discovering new copper deposits.
In 20 years, BloombergNEF says copper miners need to double the amount of global copper production, just to meet the demand for a 30% penetration rate of electric vehicles — from the current 21Mt a year to 40Mt.
Copper consumption by green energy sectors globally is expected to jump five-fold in the 10 years to 2030, data from consultancy CRU Group shows.
The most recent report from S&P Global, ‘The Future of Copper: Will the looming supply gap short-circuit the energy transition?’, published earlier this month, concludes that, “unless massive new supply comes online in a timely way, the goal of Net-Zero Emissions by 2050 will be short-circuited and remain out of reach.”
The report goes on to say that “copper scarcity may emerge as a key destabilizing threat to international security. Projected annual shortfalls will place unprecedented strain on supply chains. The challenges this poses are reminiscent of the 20th-century scramble for oil but may be accentuated by an even higher geographic concentration for copper resources and the downstream industry to refine it into products.”
S&P therefore argues the world will need to develop many large new copper mines, about three “Tier 1” mines per year for the next 29 years, to have enough new copper to achieve the lofty goals of net-zero carbon emissions.
At AOTH, we are paying close attention to companies that hold highly prospective copper projects that could help to alleviate the coming supply shortage, and contribute to the global copper supply chain that is an essential part of the shift to decarbonization and electrification.
Copper Outlook


Add SPQ (ASX) to my watchlist
 (20min delay) (20min delay)
|
|||||
|
Last
0.8¢ |
Change
-0.001(11.1%) |
Mkt cap ! $16.01M | |||
| Open | High | Low | Value | Volume |
| 0.9¢ | 0.9¢ | 0.8¢ | $20.15K | 2.486M |
Buyers (Bids)
| No. | Vol. | Price($) |
|---|---|---|
| 7 | 1825138 | 0.8¢ |
Sellers (Offers)
| Price($) | Vol. | No. |
|---|---|---|
| 0.9¢ | 1256123 | 8 |
View Market Depth
| Last trade - 16.10pm 20/05/2024 (20 minute delay) ? |

|
|||||
|
Last
0.8¢ |
Change
-0.001 ( 11.1 %) |
||||
| Open | High | Low | Volume | ||
| 0.8¢ | 0.9¢ | 0.8¢ | 2422200 | ||
| Last updated 15.35pm 20/05/2024 ? | |||||
| SPQ (ASX) Chart |