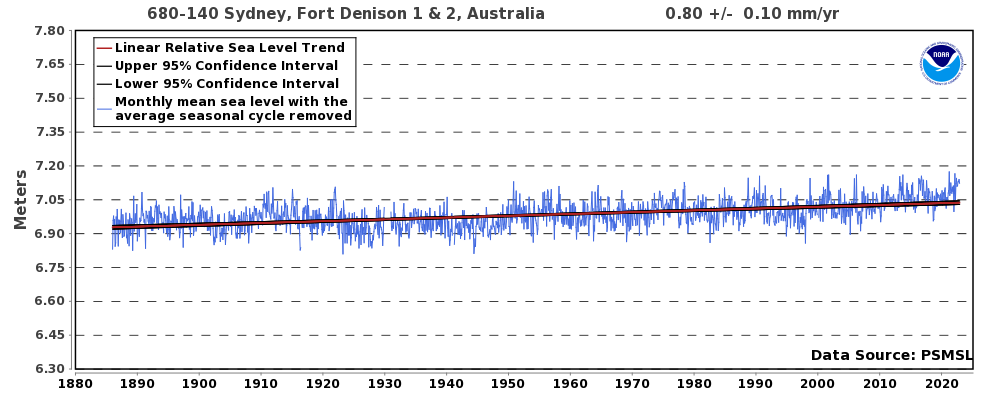
Sea level trend at Fort Denison measured over the last 130 years.
The data compiled by NOAA shows zero change in sea level trend measured at Fort Denison. This is despite atmospheric carbon rising by a significant amount (depending on which measurement you use).
https://tidesandcurrents.noaa.gov/sltrends/sltrends_station.shtml?id=680-140
By the way, the above data is mirrored around the world in places such as Battery Park New York (also zero change in sea level trend).
- Forums
- ASX - By Stock
- ADN
- General comments/chat
General comments/chat, page-33409
-
-
- There are more pages in this discussion • 10,641 more messages in this thread...
You’re viewing a single post only. To view the entire thread just sign in or Join Now (FREE)
Featured News
FWD
Queensland's housing crisis an opportunity for ASX builder Fleetwood – and taxpayer cash a safe harbour from the storm
SKS
SKS Technologies wins US$90M award to supply power to international hyperscale data centre in Melbourne
Add ADN (ASX) to my watchlist
|
|||||
Last
1.7¢ |
Change
0.001(6.25%) |
Mkt cap ! $52.87M |
Open | High | Low | Value | Volume |
1.6¢ | 1.7¢ | 1.5¢ | $56.04K | 3.534M |
Buyers (Bids)
No. | Vol. | Price($) |
---|---|---|
3 | 67044 | 1.6¢ |
Sellers (Offers)
Price($) | Vol. | No. |
---|---|---|
1.7¢ | 2945887 | 9 |
View Market Depth
No. | Vol. | Price($) |
---|---|---|
2 | 1000 | 0.016 |
38 | 10074219 | 0.015 |
12 | 2236049 | 0.014 |
7 | 2633923 | 0.013 |
6 | 1655833 | 0.012 |
Price($) | Vol. | No. |
---|---|---|
0.017 | 2945887 | 9 |
0.018 | 2862774 | 9 |
0.019 | 3659762 | 9 |
0.020 | 1653444 | 13 |
0.021 | 1350000 | 2 |
Last trade - 16.10pm 12/07/2024 (20 minute delay) ? |
Featured News
ADN (ASX) Chart |