X_Tex
As you pointed out on Tuesday, the SP500 and DJIA charts look similar. I would add that the XJO chart is also very similar those major US indices in many respects. All three are very delicately poised and all three are potentially about to rebound from a 23.6% pullback from their all-time highs...or not!
Below is my XJO chart. I'm increasingly of the view that a major correction is more likely than not. The January price action may well tell the story imho.
And I too enjoy the game of chess!
-HBG
oops!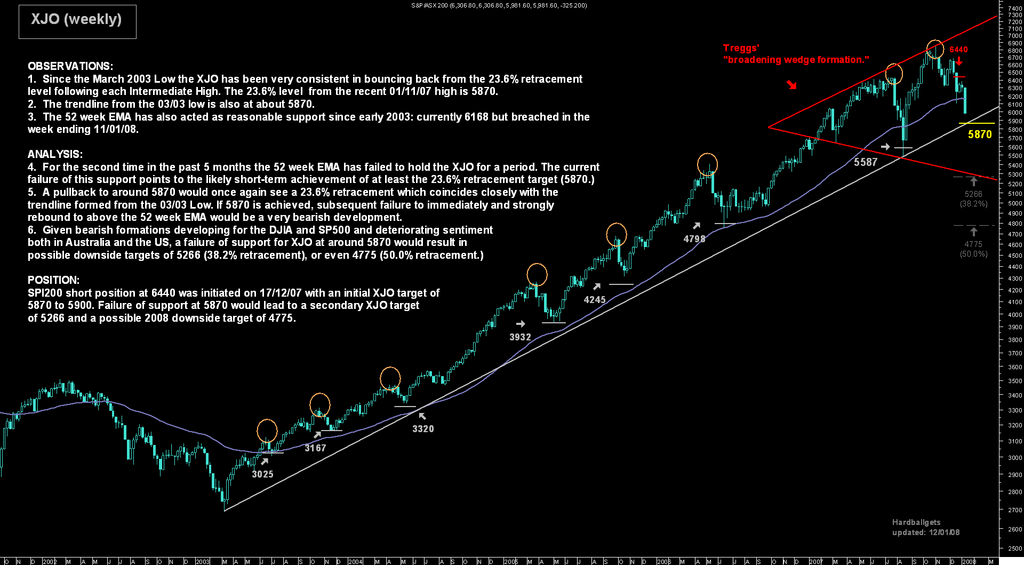
X_TexAs you pointed out on Tuesday, the SP500 and DJIA charts...


Add XJO (ASX) to my watchlist
 (20min delay) (20min delay)
|
|||||
|
Last
8,092.3 |
Change
139.100(1.75%) |
Mkt cap ! n/a | |||
| Open | High | Low |
| 7,953.2 | 8,092.3 | 7,952.8 |
| XJO (ASX) Chart |