Some of the best Lithium/LCE research I've seen.
We are going to need a better boat and the math shows it!
Table 2 and 3 got my attention
I twitted this also.
**The NOTES and the comments on those notes are a read in themselves.
https://seekingalpha.com/article/4065523-teslas-model-3-launch-will-lithium-come
Tesla's Model 3 Launch: Where Will The Lithium Come From?
Apr.26.17 | About:
Tesla Motors (TSLA)

Juan Carlos Zuleta
Research analyst, portfolio strategy, energy, natural resources
EVWorld-Commentary
Summary
In 2014, Tesla announced it would produce 500,000 EVs by 2020, but a few months ago said that this target will be met in 2018 and doubled for 2020.
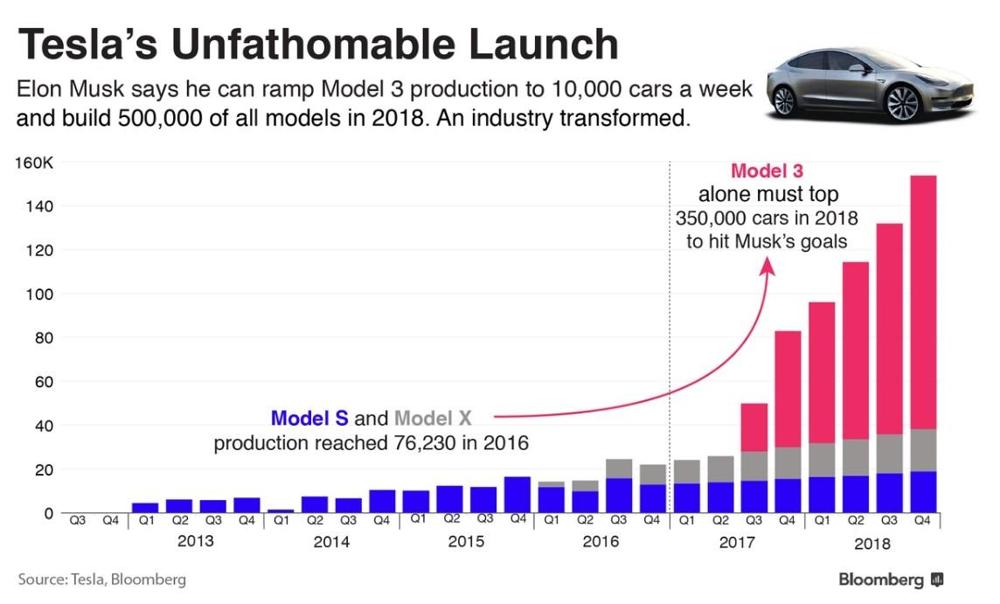
Bloomberg has depicted in a chart the evolution of Tesla sales in 2013-2016, including a projection for 2017-2018, with emphasis on the launch of the Model 3.
In this article, the actual numbers Bloomberg utilized to make its chart are estimated to find out how much lithium Tesla will require for 2017-2018.
A breakdown of global demand for and supply of lithium for 2016-2018 is presented to see where the lithium needed by Tesla beginning next July will come from.
It’s demonstrated that not only Panasonic, Tesla’s supplier of Li-ion batteries, but also Sumitomo, Panasonic’s supplier of cathode material, may have reasons to worry about lithium in 2017-2018.
When announcing the construction of a new Lithium-ion battery Gigafactory in Nevada some years ago, Elon Musk said that Tesla Inc. (
TSLA) was to produce there enough batteries to power half a million electric cars by 2020.
This projection has since been significantly modified. Last year Tesla indicated that they will produce 500,000 EVs by 2018 and
1 million such cars by 2020. There are still some questions as to whether this will imply doubling the size and/or cost of the Gigafactory, whether the Fremont plant in California will have to be expanded as well to take care of this new objective, or whether, under the new plan, the target set for stationary energy storage will also need to be duplicated.
Regardless of those considerations, though, Tesla’s CEO seems to be serious about launching production of the Model 3 next July to ramp up manufacturing thereafter and put into effect the “Lithium Revolution” in the world.
In the following chart,
Bloomberg depicts the evolution of Tesla sales between 2013 and 2016, including a projection for the period 2017 2018.
Figure 1

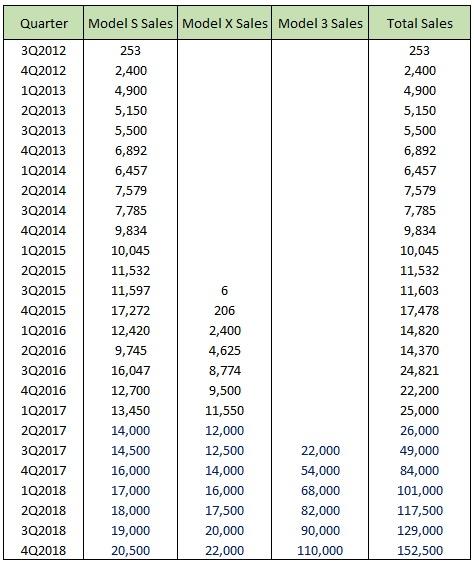
In order to know what this “unfathomable launch” would imply for lithium, we need the actual numbers Bloomberg utilized to make its chart. Since these data are not available, we can proceed to estimate them visually, under two broad guidelines suggested in the Bloomberg chart: i) Model 3 alone tops 350,000 cars in 2018, and ii) all three models comprise 500,000 production units the same year.
The results of this exercise are presented in Table 1. Note that I used official Tesla numbers from 3Q2012 to 1Q2017 and projections for quantities thereafter.
Table 1
Actual and Projected Global Production
3Q2012 – 4Q2018

Source:
Tesla and Bloomberg.
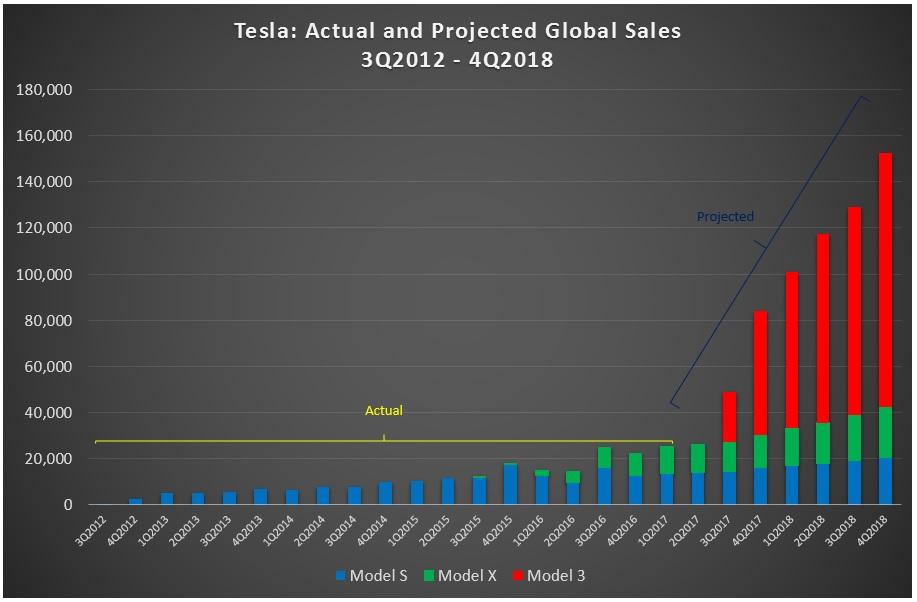
For reasons of completeness and comparison, in Figure 2, I replicate the Bloomberg chart. See how similar both charts are.
Figure 2

Source: Tesla and Bloomberg.
We are now ready to find out both how much lithium Tesla utilized between 2012 and 2016 and how much lithium it will have to use between 2017 and 2018. In addition, we are also in a position to see Tesla’s LCE consumption as a percentage of global lithium supply. This is described in Table 2.
As it can be seen, Tesla’s LCE consumption as a percentage of global lithium supply increased from 0.12% in 2012 to 3.43% in 2016 and would jump to 5.91% with the launch of the Model 3 in 2017 and to 13.62% once Tesla starts producing half a million EVs a year in 2018. Moreover, if Elon Musk fulfills his promise to produce one million EVs by 2020, Tesla’s LCE consumption would most likely surpass 20% of global lithium supply.
That being the case, it seems rather difficult to understand why it’s not interested in securing the
supply of the key battery material.
Table 2
Tesla: Actual and Projected LCE Consumption
2012-2018

Sources: Tables 1 and 3 in this contribution, and
USGS.
Note.- LCE consumption was obtained multiplying sales numbers times the battery capacity of each model divided by 1,000, assuming in all cases that 1 kWh of battery capacity requires 1kg of LCE.
Lithium: Global Demand And Supply
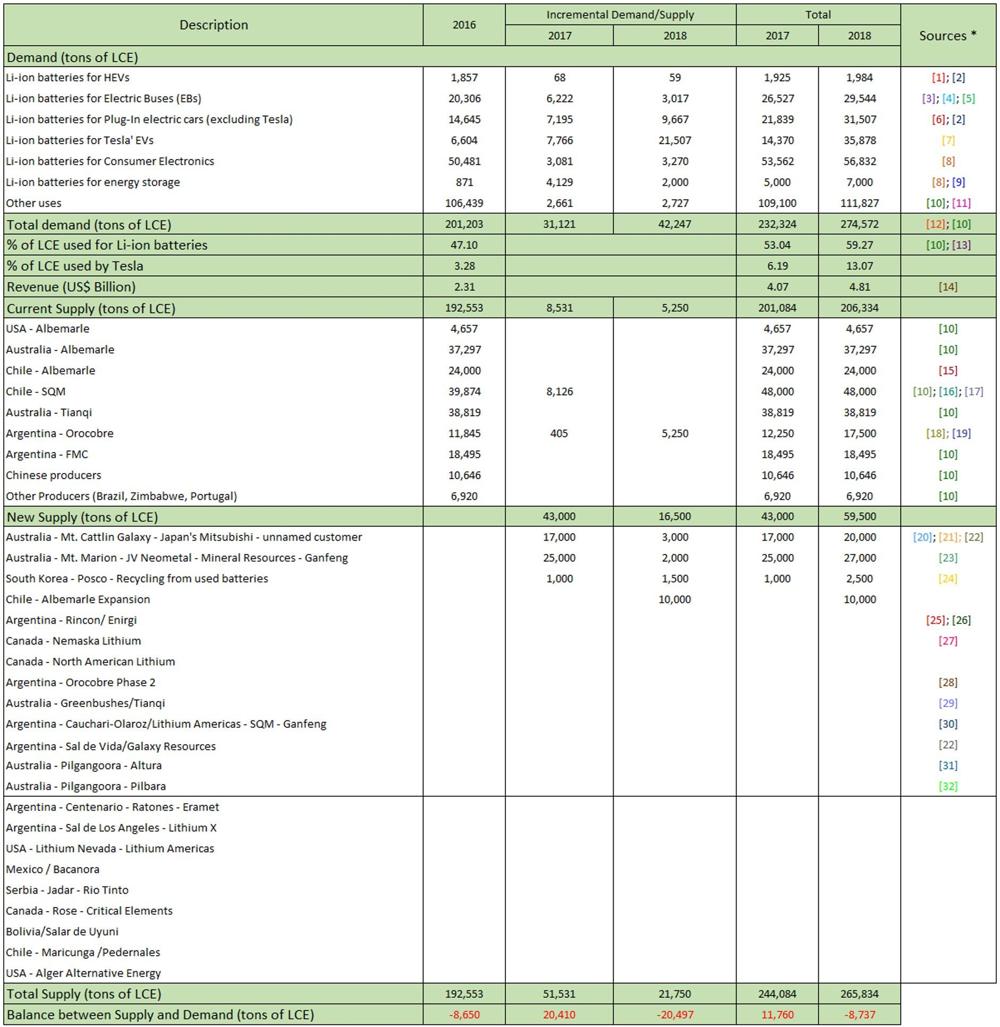
In Table 3, a detailed breakdown of global demand for and supply of lithium for the period 2016-2018 is presented with an aim to find out where the additional lithium needed by Tesla beginning July this year will come from. But before we go to that point, which in essence pertains to the supply of lithium, let me first advance the following annotations [in the same order and corresponding sources as they appear in Table 3; the links to these sources are found right after the table] and then make some comments on the demand for the lightest metal on earth.
Table 3
Lithium: Global Demand and Supply
2016-2018

* Annotations and comments are in the text.
Sources: [1]:
HybridCars, [2]:
Seeking Alpha (i), [3]:
BYD, [4]:
EV-Sales, [5]:
LG Chem, [6]:
EV-Sales, [7]:
Tesla, [8]:
Seeking Alpha (ii), [9]:
Bloomberg, [10]:
USGS, [11]:
BEA, [12]:
Seeking Alpha (iii), [13]:
Benchmark Minerals, [14]:
Benchmark Minerals, [15]:
Nasdaq, [16]:
SQM, [17]:
Seeking Alpha (iv), [18]:
Orocobre (i), [19]:
Seeking Alpha (v), [20]:
Galaxy (i), [21]:
Galaxy (ii), [22]:
Galaxy (iii), [23]:
Neometals, [24]:
Posco, [25]:
Rincon, [26]:
Roskill, [27]:
Nemaska,
[28]: Orocobre (ii), [29]:
Tianqi, [30]:
Lithium Americas, [31]:
Altura Mining, and [32]:
Pilbara Minerals.
Global Lithium Demand
Annotations:
[1] - [2]: Li-ion batteries for HEVs: Battery capacity = 1.15 kWh (2016-18). This is an average of 15 conventional hybrid models sold in the US in December 2016, according to
HybridCars.com. Sales numbers are from my 2015 Seeking Alpha article.
[3] - [4] - [5]: Li-ion batteries for Electric Buses (EBs): Battery capacity - BYD: 324 kWh (2016). Battery capacity - Yutong (2016): 245 kWh (CATL). Battery Capacity - Rest of Buses (2016): 130 (Average 60-200) kWh (LG Chem). Sales numbers are from EV-Sales. Projected sales figures were obtained using the 2015-2016 percent variation divided by two. China only.
[6] - [2]: Li-ion batteries for Plug-In electric cars (excluding Tesla): Battery capacities are from my own data base. Sales number for 2016 was estimated from EV-Sales. Projected figures were obtained using a polynomial function of order 3, similar to the one used in my previous Seeking Alpha article.
[7]: Li-ion batteries for Tesla’s EVs: Battery capacity: 85 kWh (Model S); 90 kWh (Model X); 65 kWh (Model 3). Sales number for 2016 is from Tesla. Projected figures for 2017-2018 come from Table 2 in this article.
[8]: Li-ion batteries for Consumer Electronics: Sales number for 2016 is from Table 2 in my latest Seeking Alpha article. Projected figures were obtained following the same procedure, using a rate of growth = 6.1% per annum.
[8] - [9]: Li-ion batteries for energy storage: Sales number for 2016 is from Table 2 in my latest Seeking Alpha article. Projected figures come from Bloomberg.
[10] - [11]: Lithium for other uses: Number for 2016 was obtained subtracting the sum of all Li-ion battery quantities from Total Demand for Lithium found in the latest USGS Lithium Report. A rate of growth = 2.0881809% per annum (Average US real GDP growth for 2010-2016 obtained from the Bureau of Economic Analysis - BEA data) was used to estimate the 2017 and 2018 figures.
[12] - [10]: 1 kWh = 1 kg of LCE. Number for Total Demand is from USGS, multiplied by 5.32282962 to convert metallic lithium into lithium carbonate.
[10] - [13]: % of LCE used for Li-ion batteries: Note that the number for 2016 appears to be much higher than that indicated by the USGS (39%), but less so than that suggested by Benchmark Minerals (42%). Neither source seems to have taken EBs into account.
[14]: Revenue: Benchmark Minerals Average Prices of Li
2CO
3 and LiOH: 1 MT of LCE = US$ 11,500 (2015-2016); 1 MT of LCE = US$17,500 (2017-2018)
Comments:
First, in 2016, Tesla’s consumption of lithium for batteries represented about 3% of global lithium demand. With the advent of the Model 3, this number would jump to 6% in 2017 and to 13% in 2018 (Note also that next year Tesla’s use of lithium could exceed that of all the rest of EV makers in the world). Moreover, during the period under consideration, these percentages almost double when we look at all Li-ion batteries alone, and at least almost triple, when we consider EV Li-ion batteries only.
Overall, the results indicate that in just two years, Tesla could become an influential actor (with a market participation of 13%) in the lithium market as a whole, as well as an important participant (with a market participation of 22%) in its Li-ion battery segment and a dominant player (with a market participation of 36%) in its EV Li-ion battery sub-segment.
Second, lithium use in batteries by electric buses constituted 10% of global lithium demand in 2016 and is expected to be around the same percentage in 2017-2018. These percentages more than double, with an ascending trend, when looked at with respect to all Li-ion batteries, and tend to diminish, from 47% in 2016, down to 41% in 2017 and 30% in 2018, when contemplated in relation to EV Li-ion batteries only.
This confirms two things: One, the not-so-negligible role of electric buses in global lithium demand in 2016, mainly due to application of a great deal of Government incentives in China. Two, the growing importance of EBs in the Li-ion battery segment of the market with respect to other players such as consumer electronics that are expected to grow at a slower pace, and the decreasing significance of EBs in the EV Li-ion battery sub-segment of the market, resulting from the recent elimination of those inducements, together with the expected exponential growth of Tesla’s Model 3 and other EVs.
One caveat in these preliminary conclusions is of course that the analysis utilizes only data for China, which carry on right now a significant level of uncertainty. Though this might be somewhat compensated in the near future with electric bus sales of certain Chinese companies in foreign markets and the recent positive evolution of other non-Chinese electric bus companies such as
Proterra and
Volvo, in the US, Europe, and in other markets. This appears to have recently led some analysts to ask themselves whether
electric buses are the new normal.
Third, the percentage of LCE used for Li-ion batteries is likely to surpass 50% of global lithium demand this year and continue to increase in 2018. By contrast, consumption of LCE for other uses as a percentage of global lithium demand is expected to decrease from about 53% in 2016 down to 47% in 2017 and to 41% in 2018. This would be a clear indication that the
Lithium Battery Revolution has begun.
Nevertheless, as mentioned in Table 3, use of lithium for batteries seems to have been highly underestimated by practically all sources of information mainly because they don’t include data on lithium consumption in batteries powering electric buses, neither in China nor anywhere else. As we have seen before, these numbers do indeed appear to make a huge difference.
Fourth, within the Li-ion battery segment, consumption of LCE for EV Li-ion batteries is likely to increase from about 22% of global lithium demand in 2016, up to 28% in 2017 and to 36% in 2018, to outdo that in consumer electronics which is to follow a downward trend, from 25% in 2016 down to 23% in 2017 and to 21% in 2018, and that in energy storage which is to jump from almost 0% in 2016 up to 2.15% this year and to 2.5% next year. Needless to say, the prospective use of LCE in Tesla’s model 3 would be the most dynamic factor in this trend.
We now turn to an analysis of global lithium supply.
Global Lithium Supply
This examination is broken down into two parts. One, pertaining to current global lithium supply, and another one relating to new global lithium supply.
Current Global Lithium Supply
For the purposes of this study, current global supply means production by companies operating in 2016. As before, let me first advance the following annotations [in the same order and corresponding sources as they appear in Table 3; the links to these sources are found right after the table] and then make some comments on the current global lithium supply.
Annotations:
[10]: Production data for Albemarle (
ALB) USA is withheld. Since 2012, the USGS has only reported the number for 2013. Figures for 2012, 2014, and 2015 were therefore estimated using the following formula: Production = Apparent Consumption + Exports - Imports. Number for 2016 is an average of those estimated values for 2012-2015, multiplied by 5.32282962 to convert metallic lithium into Li
2CO
3. It is assumed that this production is held constant in 2017-2018.
[10]: Production number for Albemarle – Australia in 2016 was obtained from USGS (Australia), multiplied by 0.49 [due to Joint Venture with Chengdu Tianqi Lithium (
SHE: 002466)] and 5.32282962 to convert lithium metal into Li
2CO
3. It is also assumed that this production remains fixed during 2017-2018.
[15]: Production number for Albemarle – Chile in 2016 was obtained from Nasdaq Call Transcript held on February 28, 2017. This figure is assumed not to change between 2017 and 2018.
[10] - [16] - [17]: Production number for Chemical & Mining Co. of Chile Inc. (
SQM) in 2016 was obtained subtracting Chile - Albemarle production from USGS (Chile) multiplied by 5.32282962 to convert lithium metal into Li
2CO
3. This number may be greatly underestimated though (See SQM presentation in April 2017 and SQM’s CEO intervention at the company’s Results - Earnings Call in March 2017). Consequently, for 2017-2018, it is assumed that SQM will operate at full capacity.
[10]: Production number for Tianqi in 2016 was obtained from USGS (Australia), multiplied by 0.51 (due to Joint Venture with Albemarle) and 5.32282962 to convert lithium metal into Li
2CO
3. It is also assumed that this production will remain fixed during 2017-2018.
[18] - [19]: Numbers for Orocobre (
OTCPK:OROCF) in 2016-2018 were obtained from different documents in Orocobre’s web page. As anticipated in a previous Seeking Alpha contribution, Orocobre does seem to continue facing many problems to ramp up which explains why it won’t be able to reach full annual capacity until 2018.
[10]: Number for FMC Corporation (
FMC) in 2016 was obtained subtracting Orocobre’ production from USGS (Argentina), multiplied by 5.32282962 to convert lithium metal into Li
2CO
3. It is further assumed that this production will be fixed in 2017-2018.
[10]: Number for other Chinese producers in 2016 was obtained from USGS (China) multiplied by 5.32282962 to convert lithium metal into Li
2CO
3. It is further assumed that this production is kept constant for 2017-2018.
[10]: Number for other producers in 2016 was obtained from USGS (Brazil, Zimbabwe, Portugal) multiplied by 5.32282962 to convert metallic lithium into Li
2CO
3. It is further assumed that this production will remain fixed during 2017-2018.
Comments:
First, there is evidence that both Albemarle and SQM in Chile
produced at full capacity in 2016. But this was not picked up by the corresponding USGS number, which fell short to accommodate the actual figures declared by both companies. So I took the figure provided by Albemarle as valid and proceeded from there to estimate the number for SQM. Note that we could have gone the other way around as well, with a similar conflicting result: Almost 10,000 tons of LCE missing from the USGS data for Chile. To take care of this problem, we assume production at full capacity for both lithium operators in 2017 and 2018.
Second, the numbers for Orocobre only reflect the difficulties faced by this company to ramp up production since its initial launch in 2015.
They also cast some doubts as to the plausibility of the traditional technology applied in this operation, let alone their decision not to explore the possibility of using alternative technologies in Phase 2 of the project.
Third, production in 2016 was concentrated in three countries: Australia, Chile and Argentina, which together comprised 88% of global supply. With a market share of almost 40%, Australia appears to be dominating the market followed by Chile with 33% and Argentina with around 16% and this is not likely to change in a major way in 2017 and 2018.
Fourth, throughout the period under consideration, we can see that only 6 companies control between 88 and 89% of the market, with Albemarle (32-34%) leading the market, followed by SQM (20-24%), Tianqi (19-20%), FMC (9-10%), and Orocobre (6-8%).
Fifth, in view of the expected negligible additional production by “current suppliers” for 2017 and 2018, it can be argued that they are not good candidates to supply any lithium for the coming Tesla Model 3.
New Global Lithium Supply
In this section, we focus our analysis only on the four operations in the process of both ramping up production at the present time and starting production in 2018. In Table 3 other operations in the pipeline with possibilities to bring production online beginning 2019 are listed as well, together with other projects with plans to become operational further down the road. In what follows, annotations and comments only in relation to operations in the pipeline are included.
Annotations:
[20] - [21] - [22]: After first and second shipments were waved off from Mount Cattlin to China in the beginning of the year, it all indicates that Galaxy (
OTCPK:GALXF) is on track to reach 17,000 tons of LCE by the end of the year completing its production ramp-up next year with another 3,000 tons of LCE.
[23]: With the second shipment from Mount Marion to China in March this year, the Joint Venture formed by Mineral Resources Ltd. (
MALRF), Neometals Ltd.
(RRSSF) and Jiangxi Ganfeng Lithium Co., Ltd. (
SHE:002460) seems to be capable of meeting the target of 25,000 tons of LCE for 2017 and the target of 27,000 tons of LCE for 2018.
[24]: In February, Posco (
PKX) completed a lithium extraction plant from used secondary batteries by using lithium phosphate from recycling companies as a raw material with an annual capacity of 2.500 tons. Tests of Li2CO3 produced from recycled material confirmed that it was equivalent to existing products in quality standards (i.e. particle size, purity, charge and discharge efficiency and capacity). It is assumed that in 2017 only 1,000 tons of Li2CO3 will be produced, reaching full capacity next year.
[25] - [26]: In July 2016, Enirgi Group, a privately held multinational conglomerate, based in Toronto, Canada, announced it had finished its feasibility study. Following Roskill, it also appears to have just completed major construction works and successful commissioning of the separation plant at its commercial-scale demonstration lithium carbonate processing direct extraction plant.
Although we can still have reasons to remain skeptical about this company's ability to add any meaningful production to the market before 2019, which essentially pertain to the not-yet-completely-proven direct extraction technology they intend to apply from the start in this operation, it might be advisable to recommend investors to keep an eye on it in the months to come.
[27]: Notwithstanding the fact that Nemaska Lithium, Inc. (
OTCQX:NMKEF) seems to be ready to deliver its first ton of LiOH from Phase 1 Plant, it will most likely add new meaningful commercial production (from its own ores) to the market only beginning 2019.
[28]: Considering the difficulties Orocobre has been facing in ramping up its initial level of production, it appears doubtful that they will be able to start a new phase of production before 2019. A recent analysis concludes the same, albeit for different reasons.
[29]: According to a recent update, Tianqi expects to complete this project in the fourth quarter 2018, which implies that production of lithium carbonate will commence in 2019.
[30]: Following the announcement of a positive feasibility study for stage 1 of the project, Lithium Americas Corp. (
OTCQX:LACDF) has recently indicated that construction will commence immediately after closing strategic investments with Ganfeng Lithium and Bangchak Petroleum expected for this month. Assuming everything goes according to plan, commissioning and first production is likely to occur in 2019.
[22]: As indicated by Galaxy, targeted first production is expected for not earlier than 2H 2019.
[31]: Although Altura Mining Ltd. (
OTCPK:ALTAF) - Pilgangoora has announced in its 2016 Report that it will start producing in Q4 2017, doubts persist as to whether it will be able to add any meaningful amounts of production to the market before 2019.
[32]: Even though
Pilbara Minerals (
PILBF) has announced in its latest presentation that in December 2016 it started the execution stage of the project, doubts persist as to whether it will add any meaningful amounts of production to the market before 2019.
Comments:
From looking at this part of Table 3, it might be quite obvious that the lithium necessary for Tesla’s Model 3 will have to come from Australia and to a lesser extent, Chile. It goes without saying that the new production by Posco is likely to go, in its entirety, to Korean consumers.
However, this may not be as clear-cut as we could imagine since both new Australian operations have signed off-take agreements with different customers,
none of which seems to be part of the Tesla lithium supply chain, and the Chilean option would have difficulties to bridge the gap.
In fact, Mount Cattlin – Galaxy has signed
definitive contracts with another Chinese off-take customer and Mitsubishi Corporation from Japan for 45,000 tons of lithium concentrate at US$600/metric ton for 2016 to be delivered in the first four months of 2017. As mentioned in Table 3, to date, two shipments have been made on compliance of these contracts, one for approximately 10,000 tons of lithium concentrate to an unnamed Chinese customer and another one for 14,000 tons to Mitsubishi Corporation.
A third shipment of about 18,000 tons of lithium concentrate is to be made in the coming days. In addition, following its latest presentation,
Galaxy has also signed off-take agreements with other Chinese converters for 120,000 tons of lithium concentrate for 2017 to be delivered between 2017 and 2018.
Likewise, Mount Marion – Joint Venture among Neometals, Mineral Resources and Ganfeng has signed an off-take agreement with
Ganfeng for 100% of production.
This would leave us with Albemarle Chile as the only option available for the supply of lithium to the Tesla Model 3. But even if we assumed that the Chilean operator manages to produce at full capacity in La Negra 2 in 2018,
something highly unlikely to occur, that production wouldn’t be enough to cover all of Tesla’s lithium requirements for its new model that year, not to mention 2017 when there is no way that Albemarle Chile can bring any new production online. Hence not only Panasonic, Tesla’s supplier of Li-ion batteries, but also Sumitomo, Panasonic’s supplier of cathode material, do seem to have many reasons to worry about lithium both this year and the next.
Lastly, as it's also shown in Table 3, the balance between supply and demand in 2016 was negative, which means that supply exceeded demand, whereas it was found to be positive in 2017 and again negative in 2018 by a similar margin to that encountered in 2016. These results explain why LCE prices were so high in 2016 and would also help us predict somewhat lower prices in 2017, and, once more, higher prices for 2018.
 !
1.8¢
 (20min delay)


