This is a very good write up.....I have been trading TLS quite a lot and done well...Massive volumes & fundies dont mind a trade themselves on TLS...how ever this is a very good write up that a lot more respectable individuals that have been in the game for a long time that are all saying the same thing....
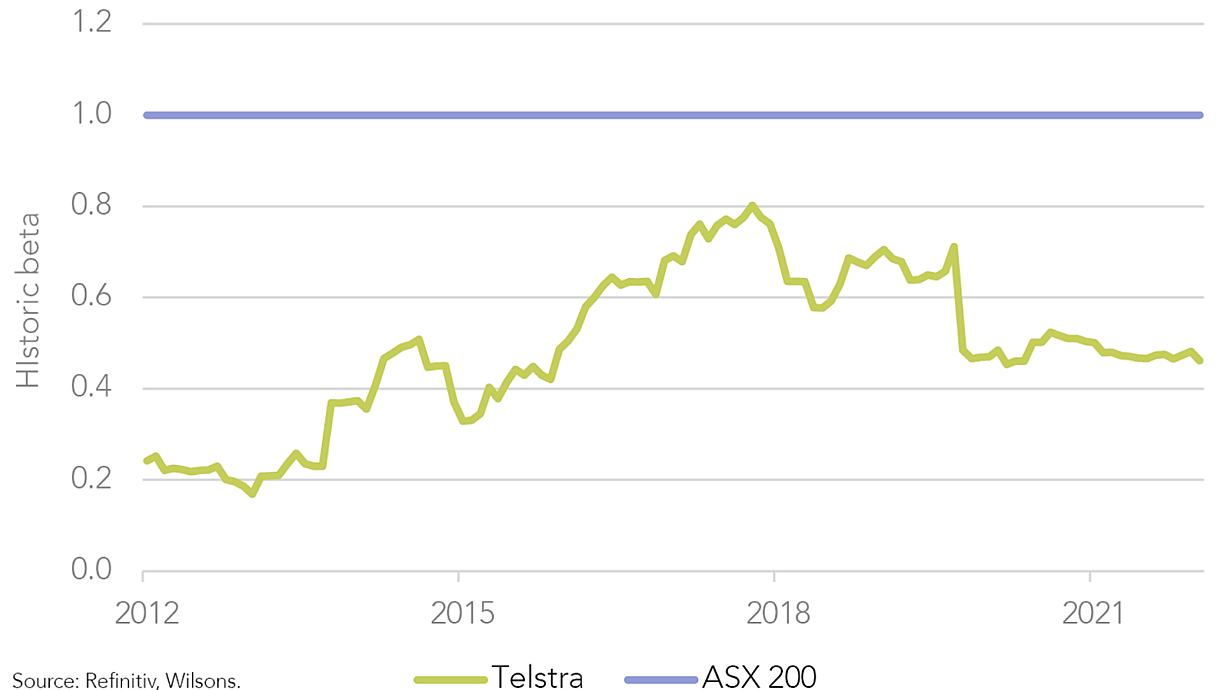
Its now been 110 days into the bear market with an average of 300 days and or 37% as credibly written and recorded...so we have more pain to go...TLS is a good place to park your car being able to sleep at night and collect divs long the way...seems now with some growth thrown in for good measure...In our latest Focus List update, we upweighted our exposure to quality defensives from 17.5% to 22.5%, which included increasing our position in Telstra (ASX:TLS) from 2% to 3% of the portfolio – a modest overweight versus the benchmark.In the modern world, digital connectivity is all but essential. This helps support consistent user demand for mobile and fixed network plans from leading telcos such as Telstra through the cycle, while the company’s owned infrastructure (e.g. fibre, ducts, mobile towers) provides annuity-like cash flows that are even more predictable. Telstra dominates the Australian telecommunications oligopoly with the best network and ~50% mobile market share.
Figure 1: Telstra is a low beta company given its defensive earnings profile
Key Earnings Drivers:
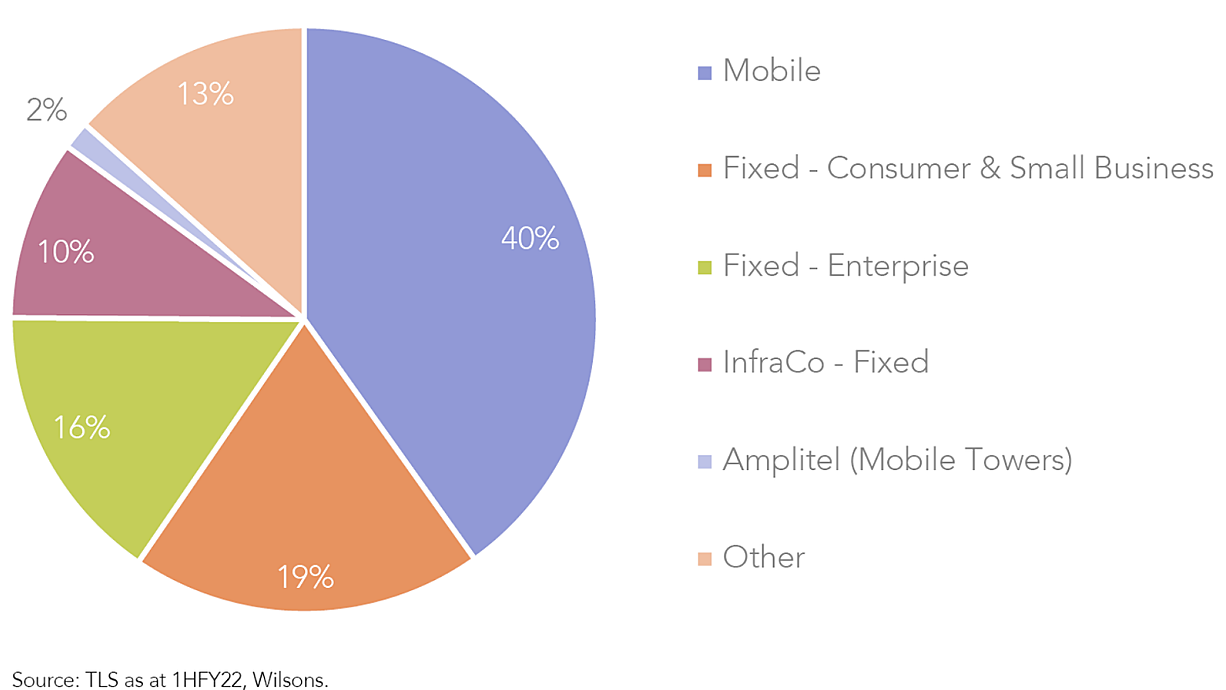
Telstra’s major segments include:
- Mobile: postpaid and prepaid mobile plans, mobile broadband, 5G connectivity. Provided through owned infrastructure.
- Fixed – Consumer & Small Business: National Broadband Network (NBN) internet plans, fixed-line telephony, entertainment (e.g. Foxtel), legacy copper network (now largely replaced by NBN).
- Fixed – Enterprise: data and connectivity, network applications and services (NAS), and cloud services.
- InfraCo – Fixed: data centres, optic fibre, ducts, pipes and fixed network sites.
- Amplitel: >8k mobile towers and supporting infrastructure (51% stake) – Australia’s largest mobile network.
Figure 2: Mobile is the key driver of Telstra’s income
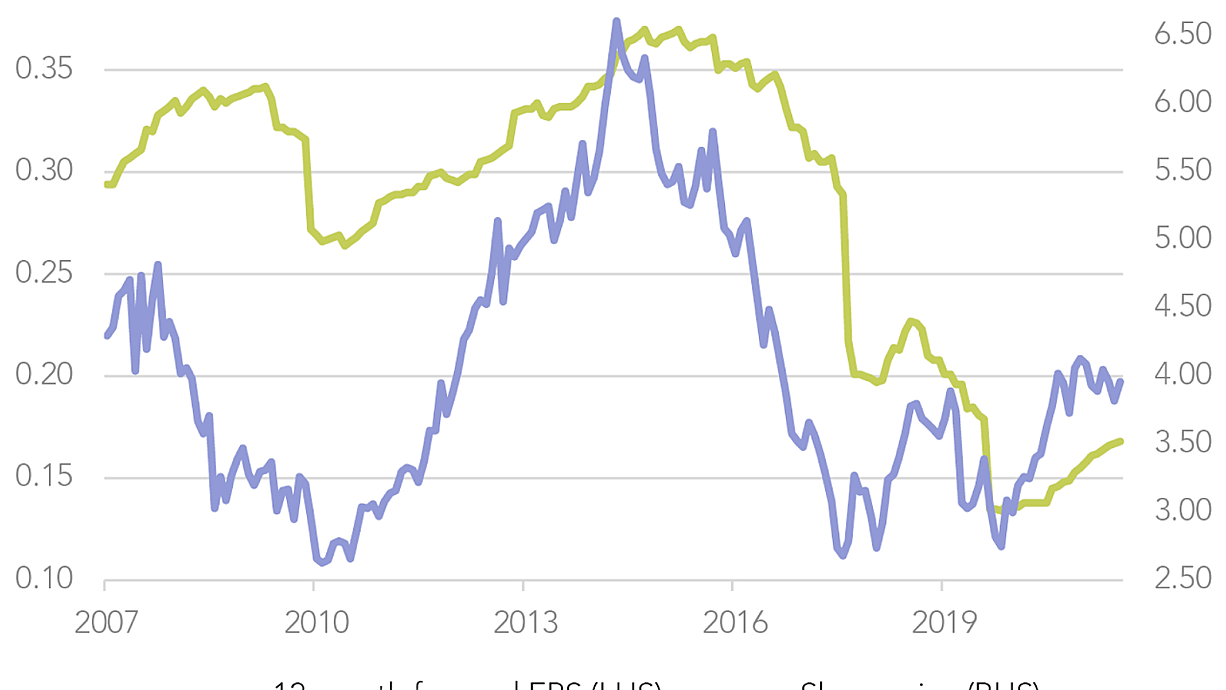
Telstra’s earnings have been plagued by NBN headwinds over the last decade
Telstra’s share price started coming under pressure in 2015, largely due to the impact of the Federal Government’s NBN roll out, which has been a significant headwind to earnings in recent years.
Figure 3: Telstra’s EPS has more than halved since 2016
The NBN has progressively replaced Telstra’s legacy fixed-line copper wire network, which previously connected most of Australia’s homes. As a consequence, Telstra is no longer the predominant wholesale fixed line network provider in Australia, which has led to a significant loss of revenue as customers transition towards NBN broadband services.
In its fixed line business, Telstra has gone from being vertically integrated, as both an infrastructure owner and a retail service provider, to now merely acting as a retail provider that re-sells access to the NBN, competing with other service providers on a level playing field. Telstra has labelled this permanent, recurring loss of earnings to the NBN as the ‘in-year NBN headwind’.
The NBN roll out has also driven a significant increase in the cost of providing fixed broadband services for both Telstra and its competitors, putting fixed-line reseller margins under pressure. We have also witnessed elevated competitive intensity between major players in the mobile market, with aggressive price cutting squeezing operator margins even further.
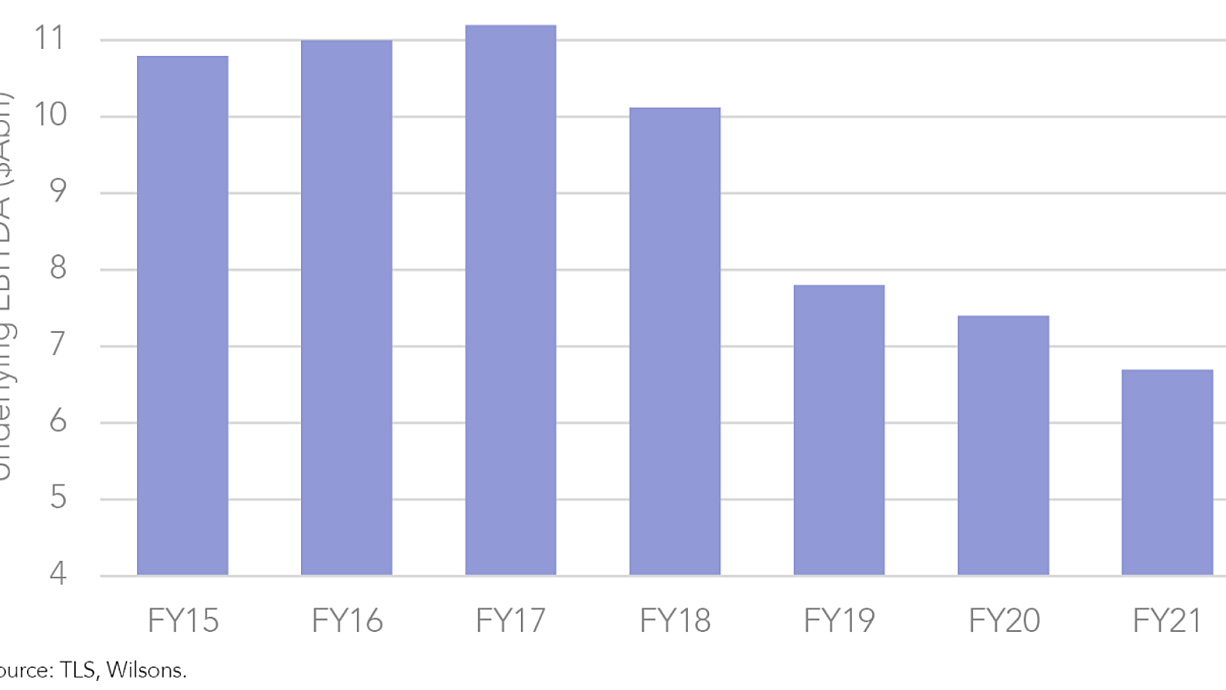
The downward trajectory of Telstra’s earnings in recent years has reflected this challenging industry backdrop.
Figure 4: Telstra’s underlying EBITDA has drifted lower due to NBN headwinds and intense competition between mobile service providers
Are we at an inflexion point?
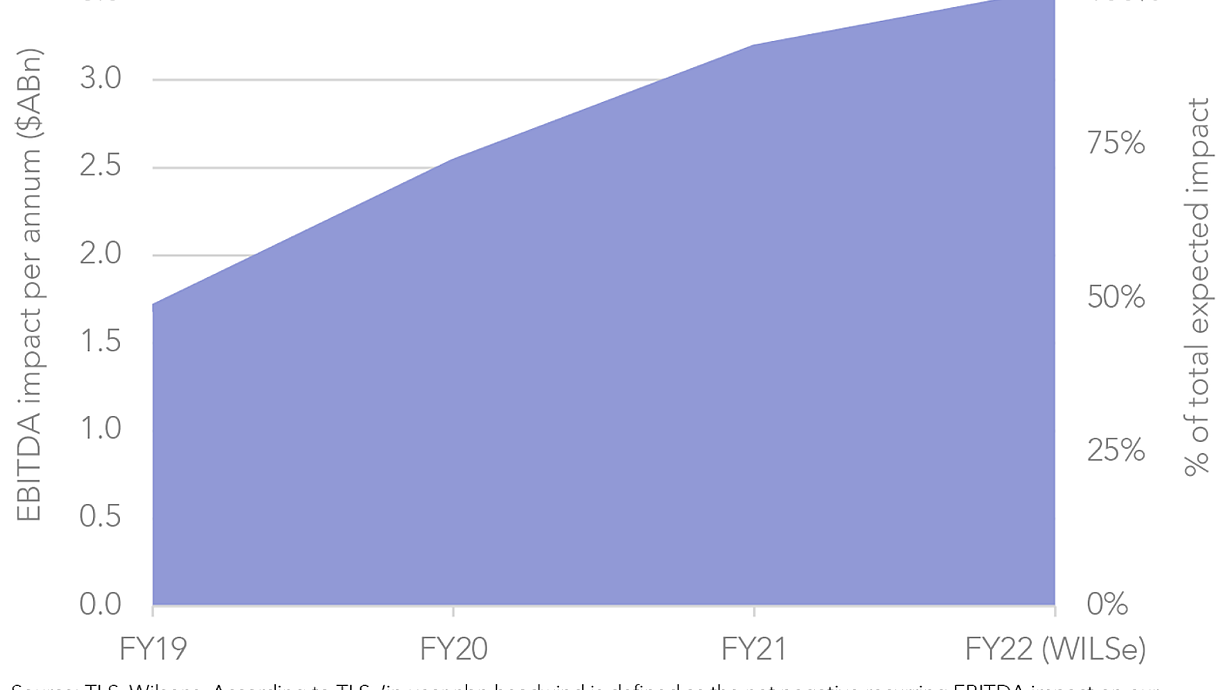
On the bright side, as the NBN roll out is now effectively complete, we are at the tail-end of the so-called NBN headwinds, with management suggesting the ongoing drag from the migration off its legacy network is all but over.
Figure 5: NBN Headwinds have nearly peaked
Of course, this still leaves a permanent hole in Telstra’s earnings given the loss of its legacy fixed-line network. However, as this hole is no longer growing, earnings will likely have bottomed out in FY22, establishing a new base to grow from in the future.
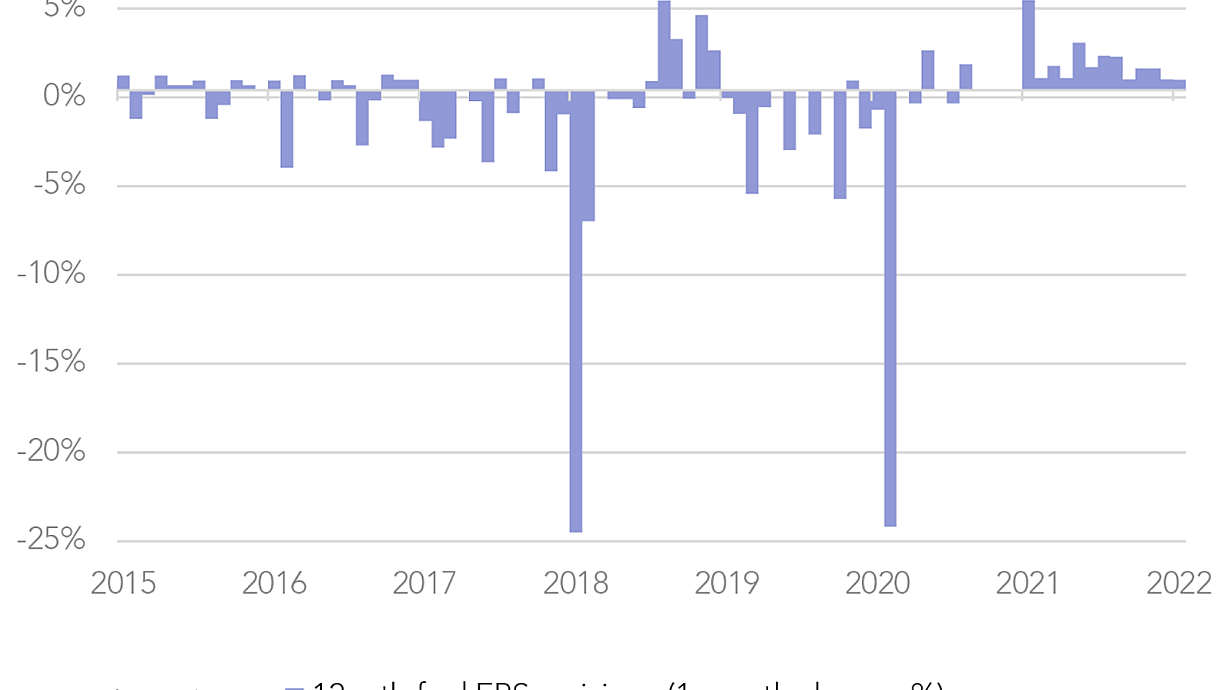
Consistent with the improved backdrop, we believe Telstra is entering into an EPS upgrade cycle, with analysts increasing their earnings forecasts in a sustained manner for the first time in years.
Figure 6: EPS expectations for Telstra are now being upgraded by the street
Telstra’s latest strategy, ‘T25’, has the objective of achieving a mid-single digit underlying EBITDA CAGR and a high-teens underlying EPS CAGR to FY25, which will represent a material step change in the company’s earnings trajectory, if achieved.
Figure 7: T25 Goals point to step change in Telstra’s underlying EBITDA trajectory
How Can Telstra Grow Its Earnings?
In addition to the end of the NBN headwinds, Telstra’s medium-term earnings outlook is supported by a number of factors:
- Improved competitive setting: after years of intense competition, we believe the Australian telco sector has entered into a period of more rational pricing. The ability to raise prices in mobile (without losing share) will be key to drive ARPU (Average Revenue Per User) and therefore higher earnings. Recent evidence is constructive, with Telstra and Optus both recently lifting their prices and signalling more hikes to come, in line with CPI at least. Optus has explicitly stated it will not compete on price. TPG is the only major player that is yet to lift its prices on mobile plans.
- Cost outs: CEO Andy Penn’s T22 cost reduction strategy is on track to deliver its targeted $2.7bn in annual recurring cost reductions by FY22, helping to plug some of the revenue gap created by the NBN. The latest ambition set out in its T25 strategy is to deliver a further $500m p.a. reduction to the cost base from FY23 to FY25, which would be accretive to margins over the medium-term.
- Roaming recovery: the return of international travel to pre-COVID levels should drive a ~$200m p.a. uplift in revenues from roaming payments.
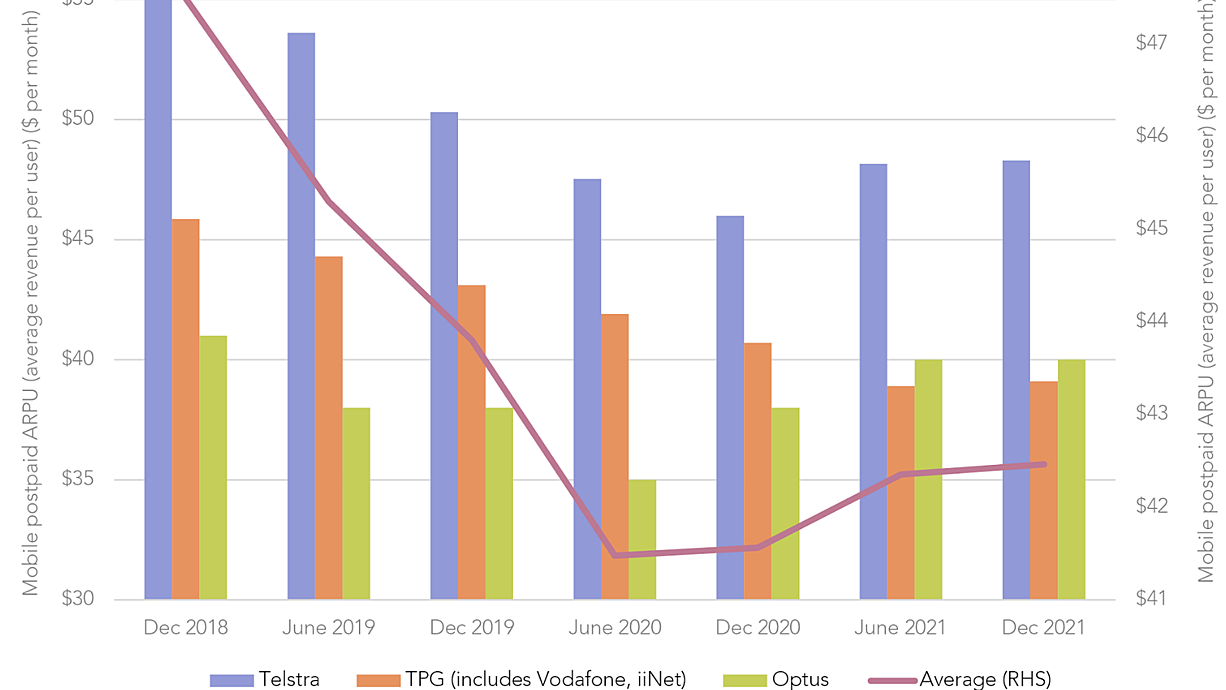
- 5G leadership: Telstra’s 5G network is more than twice the size of the closest competitor, covering nearly 80% of the population and connecting close to 3 million devices. Under T25, the company will continue to invest in its network leadership to achieve ~95% coverage and to have ~80% of mobile traffic on its 5G network by 2025. By maintaining its brand superiority with the best network and the widest reach, Telstra should be able to drive APRU growth by converting customers to higher priced packages.
Figure 8: Mobile ARPUs are starting to rise again
Unlocking embedded infrastructure value
Telstra is close to structurally separating its consumer facing business from its infrastructure assets. This will position the company to realise shareholder value that has been hidden in the previous amalgamated structure, given the strong institutional investor demand for strategic infrastructure assets, which typically command substantially higher earnings multiples as pure play investments.
The company started unlocking the intrinsic value of its infrastructure in 2021 when it sold a 49% stake in its mobile towers (Amplitel) for $2.8bn, reflecting a total value of $5.9bn and an attractive EV/EBITDA multiple of 28x - a substantial premium to Telstra’s current trading multiple of ~7.9x. Around 50% of the net proceeds of the deal were returned directly to shareholders.
Other recent transactions in the ANZ telco infrastructure sector include:
- In July 2022, Spark New Zealand (ASX:SPK) sold a 70% stake in its mobile towers for NZ$900m, at a 33.8x EBITDA multiple.
- In April 2022, Uniti Group (ASX:UWL), which is a ‘last mile’ network infrastructure owner, was acquired at a forward EBITDA multiple of 25.7x.
- In October 2021, Optus’ parent company Singtel (ASX:Z74) sold 70% of its Australian towers for $1.9bn at an EV/EBITDA multiple of 38x.
- In June 2021, Vocus (ASX:VOC), a fibre and network solutions provider, was acquired for $4.6bn at a trailing EV/EBITDA multiple of 12x.
- In June 2020, prior to being taken over, UWL acquired Opticom, a fibre network builder and operator, for $530m at an implied EV/EBITDA multiple of 13.5x.
Telstra is likely to monetise more of its infrastructure over the medium-term, likely through the sale of minority interests in its assets like the Amplitel deal.
The next logical candidate is InfraCo – Fixed, which generates more than 6x the earnings of Amplitel, delivering >$2bn p.a. in external access revenues for fibre, network sites and ducts. Putting the FY21 EBITDA contribution of InfraCo – Fixed ($2.66bn) on a 12x multiple – which could prove to be conservative – implies an enterprise value of ~$32bn.
We believe the capital raised by future asset divestments will help to underwrite Telstra’s ordinary dividend payments while delivering incremental value to shareholders by funding large capital management initiatives like special dividends and share buybacks.
Valuation looks attractive
We prefer to assess Telstra’s valuation using cash earnings, rather than statutory earnings, because the company’s CAPEX is expected to be structurally lower than its depreciation and amortisation over the medium-term, given historically higher CAPEX and the mix of asset lives. Therefore, cash flow provides the best measure of Telstra’s underlying performance and is likely to remain ahead of accounting earnings.
Taking this into consideration, Telstra trades on a 12-month forward EV/EBITDA of 7.9x and a forward Price/ Equity Free Cash Flow multiple of 16.4x. This looks attractive relative to other ASX defensives, and given the expected recovery in the company’s earnings and the significant intrinsic value embedded within its infrastructure assets that is likely to be unlocked over the medium-term.
Where to now for long term investors of Telstra, page-11966


Add TLS (ASX) to my watchlist
 (20min delay) (20min delay)
|
|||||
|
Last
$3.94 |
Change
0.040(1.03%) |
Mkt cap ! $45.52B | |||
| Open | High | Low | Value | Volume |
| $3.90 | $3.94 | $3.89 | $114.7M | 29.20M |
Buyers (Bids)
| No. | Vol. | Price($) |
|---|---|---|
| 3 | 75339 | $3.93 |
Sellers (Offers)
| Price($) | Vol. | No. |
|---|---|---|
| $3.94 | 21984 | 1 |
View Market Depth
| Last trade - 16.10pm 31/07/2024 (20 minute delay) ? |
| TLS (ASX) Chart |